





About this worksheet
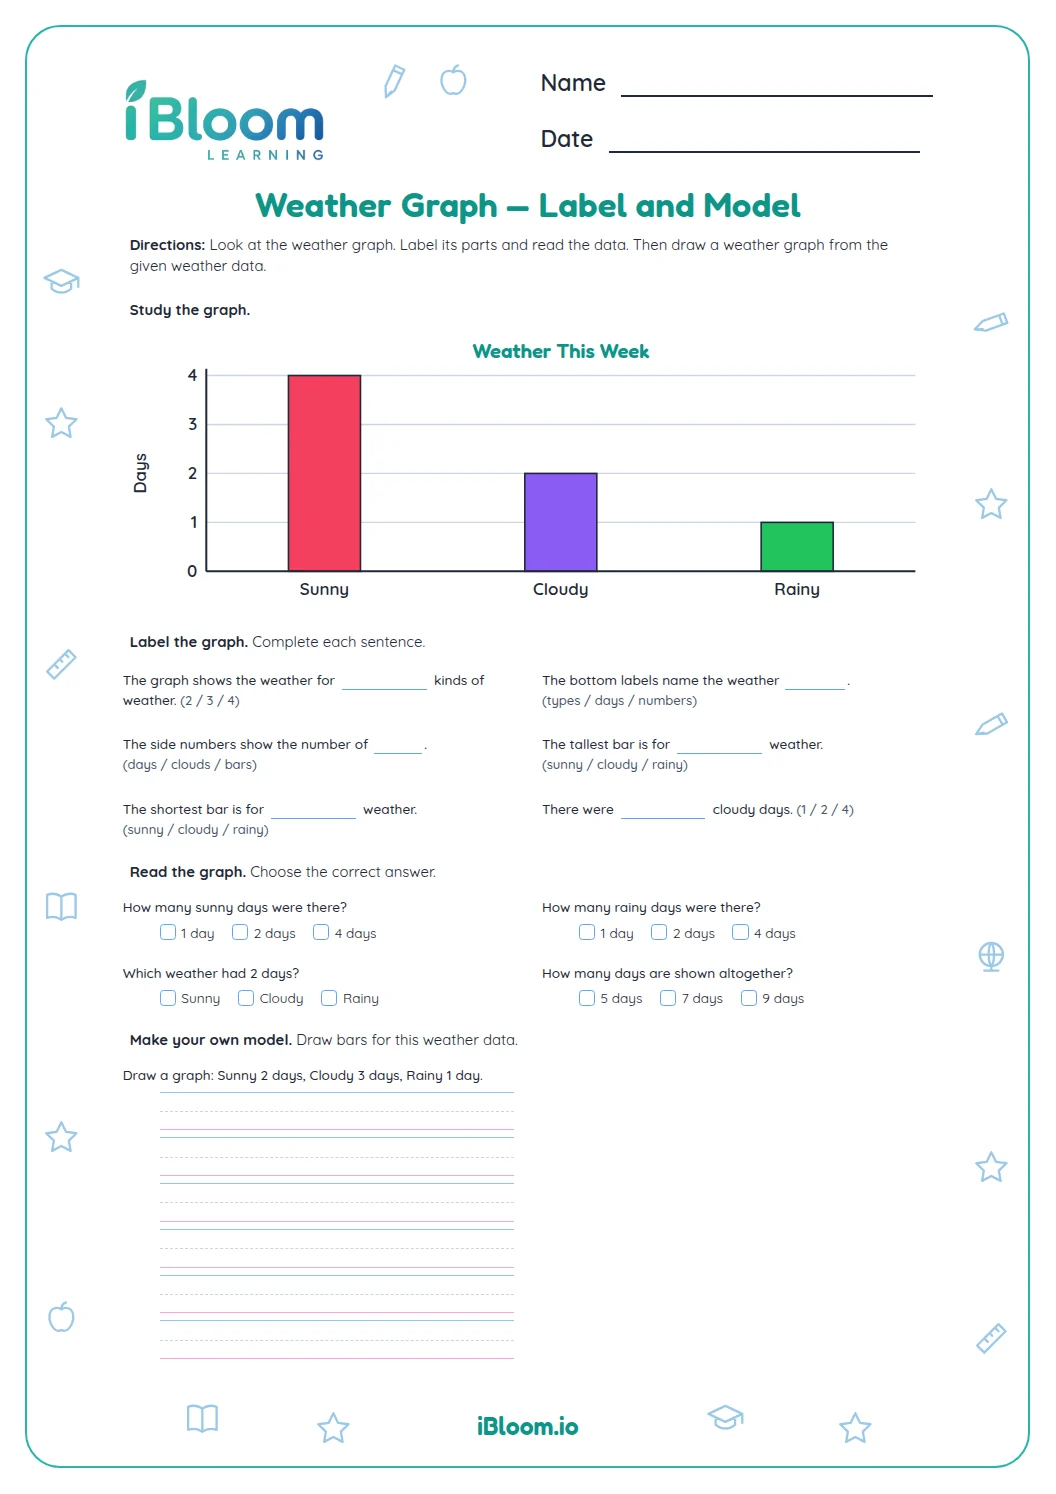
This printable uses a sample weekly weather graph for Grade 1 science and data practice. Children read the bars, compare sunny, cloudy, rainy, and windy day counts, and consider how changing one observation changes a total. The graph is labeled in days, so each bar can be checked against the vertical scale.
How does a weather graph help?
A bar graph makes a set of observations easier to compare. Read the category names along the bottom, then use the scale to see how many observations each bar represents. The bars on this page record seven sample days.
What will children reason about?
Part A reads the four bars and compares their counts. Part B uses the graph to answer totals, category comparisons, and simple what-if questions.
How to use this worksheet
- 1Read the graph title and check that the vertical scale counts days.
- 2Find a category label, then read its bar height.
- 3Compare or add the counts named in each question.
- 4For a what-if question, change only the stated day and recount.
Common slips
The mistake
Calling the tallest bar the weather with the fewest days.
The fix
Compare the bar tops with the number scale.
The mistake
Treating a one-day change as changing every category.
The fix
Change only the bar named in the question, then recount.
What to practice next
Make more practice
Questions parents and teachers ask
Are the bars a forecast?
No. They show sample weather observations recorded during one week. A graph organizes data that has already been collected; it does not predict tomorrow’s weather. Children use the bars only to answer questions about this seven-day record. These sample values are for practice and do not describe a particular town or a real forecast.
How many observations are in the full week?
The four weather bars total seven observations. Add the sunny, cloudy, rainy, and windy counts to check the week’s total. This sample data set is used to practice reading and comparing categories. Children can check their addition by counting the total number of recorded days.
What skills does the page practice?
Students read a bar graph, compare weather categories, combine counts, and check a statement against the data. Later questions change one recorded day and ask children to reason about the updated counts. A count represents an observation, so a single day is one data point.
Is there one correct answer for each item?
Yes. Each question points to a value, comparison, or change that can be checked against the displayed graph. For questions that ask for one weather type, the graph includes a unique matching category. A count represents an observation, so a single day is one data point.
Are the graph values a forecast?
No. The graph is a sample record of weather observations for a week, not a forecast. Its bars show sunny, cloudy, rainy, and windy days. Children use those displayed counts to answer questions and reason about a changed observation.