

About this worksheet
This Grade 2 printable pairs four line-plot questions with ten addition and subtraction story problems. Students count X marks above a named value in plots about ribbon lengths, books, cups, and jumps, then solve separate stories about totals and amounts left. The arithmetic stories practice CCSS 2.OA.A.1, and a separate answer key lists each result.
Aligned to 2.OA.A.1
How do you read a line plot?
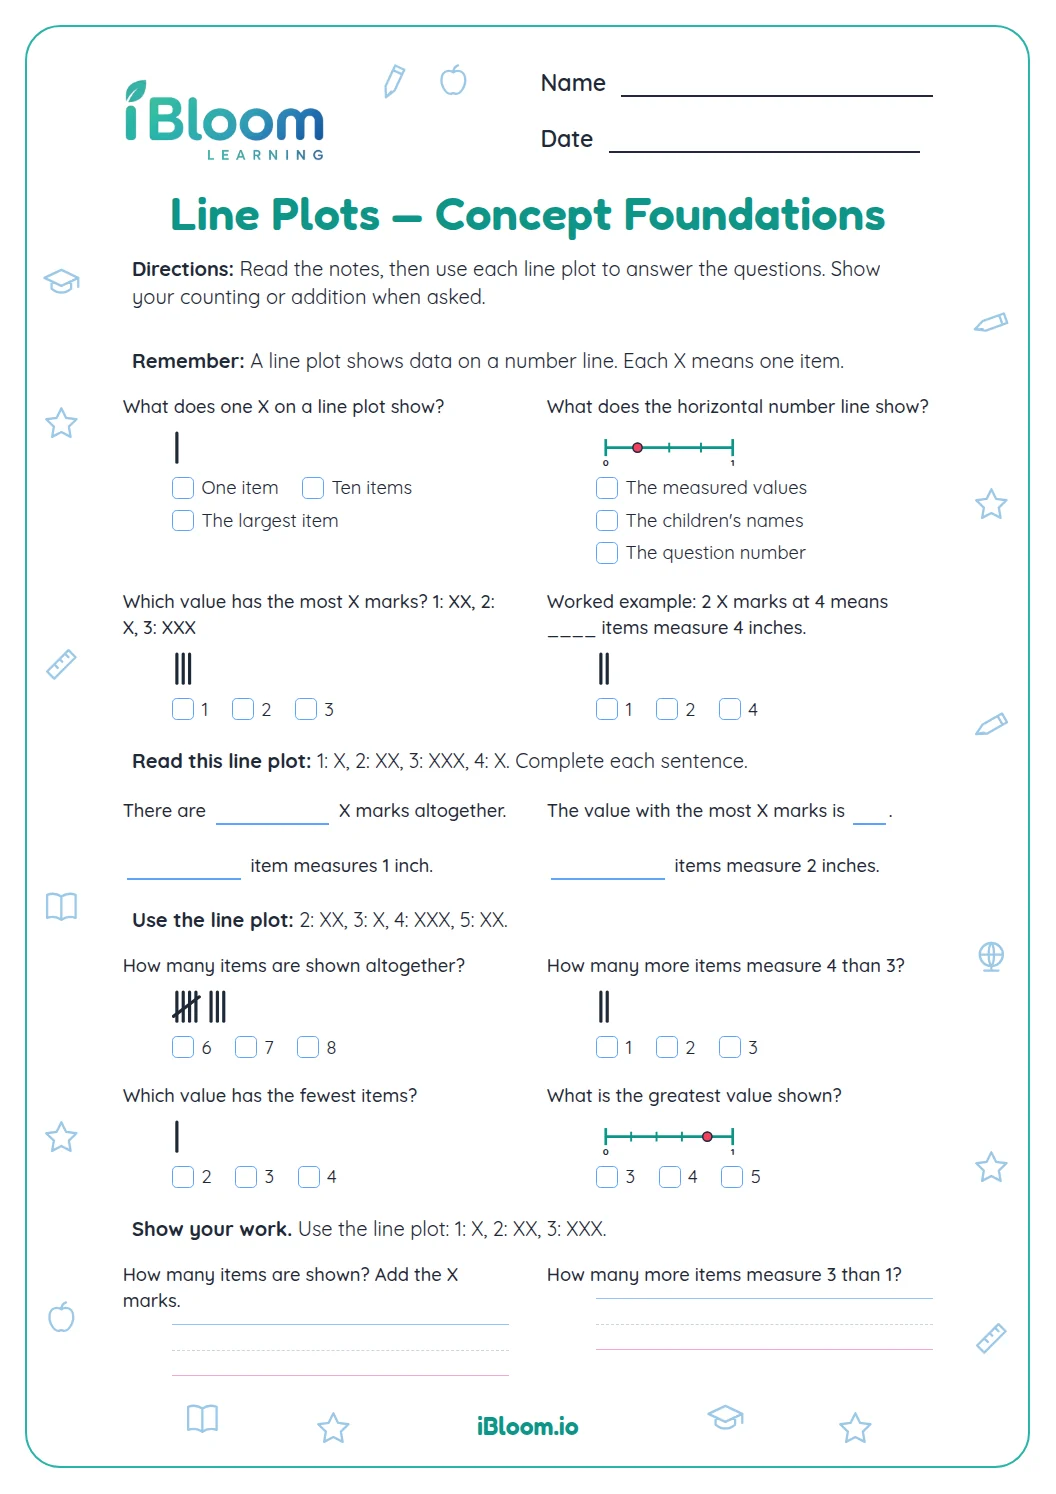
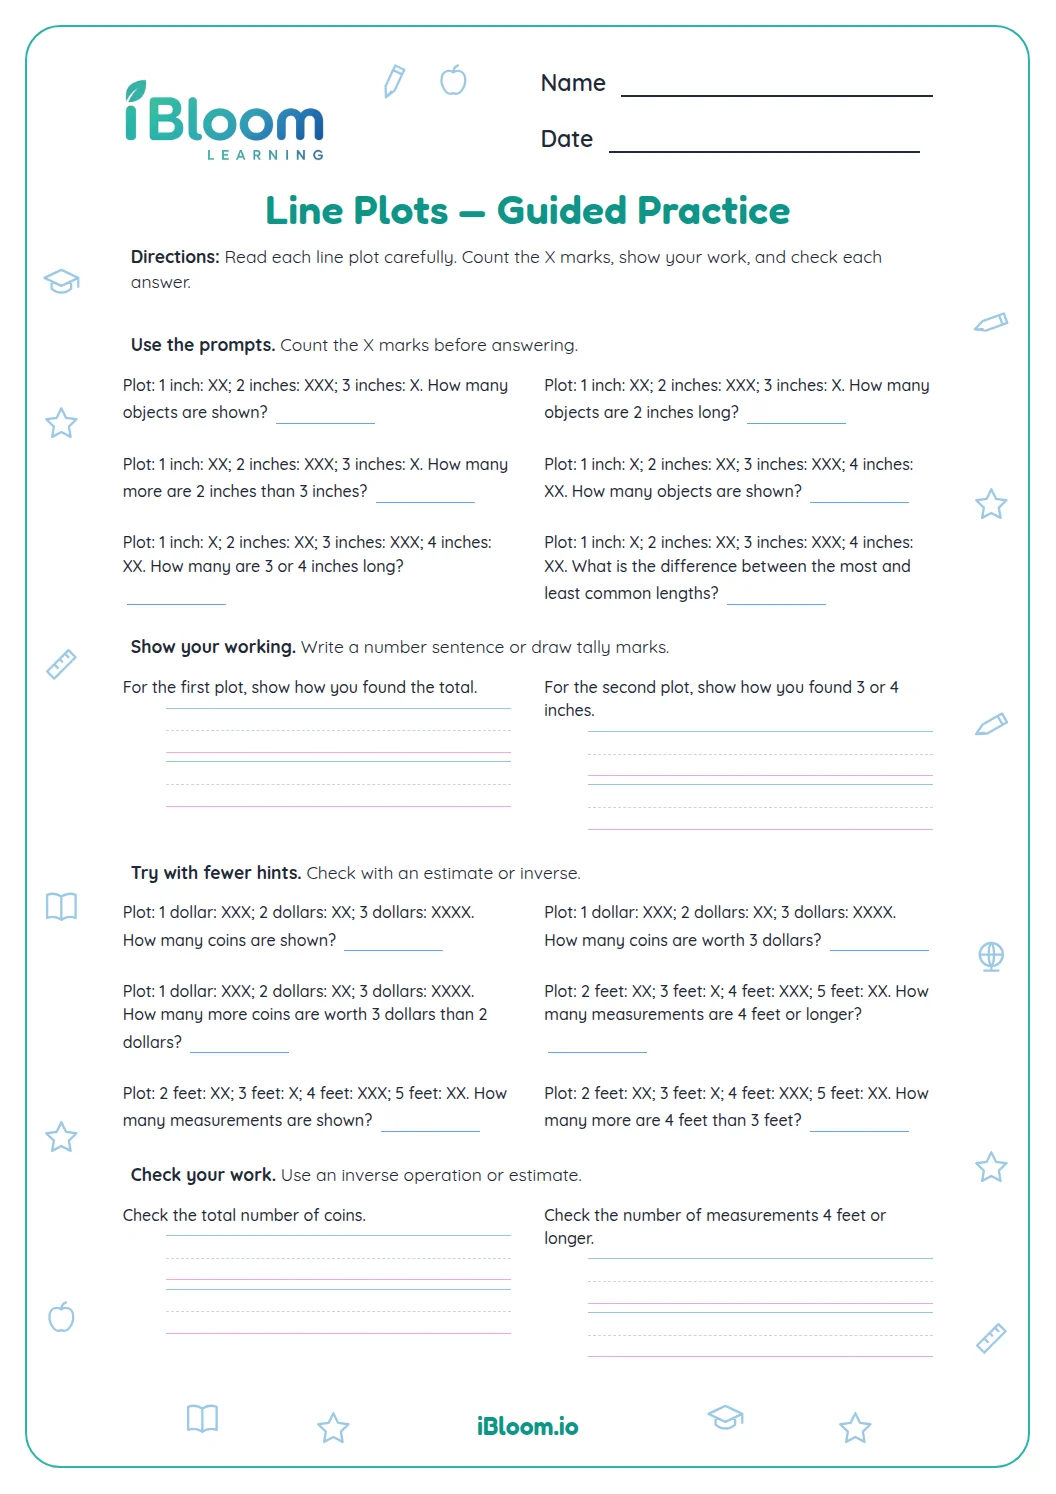
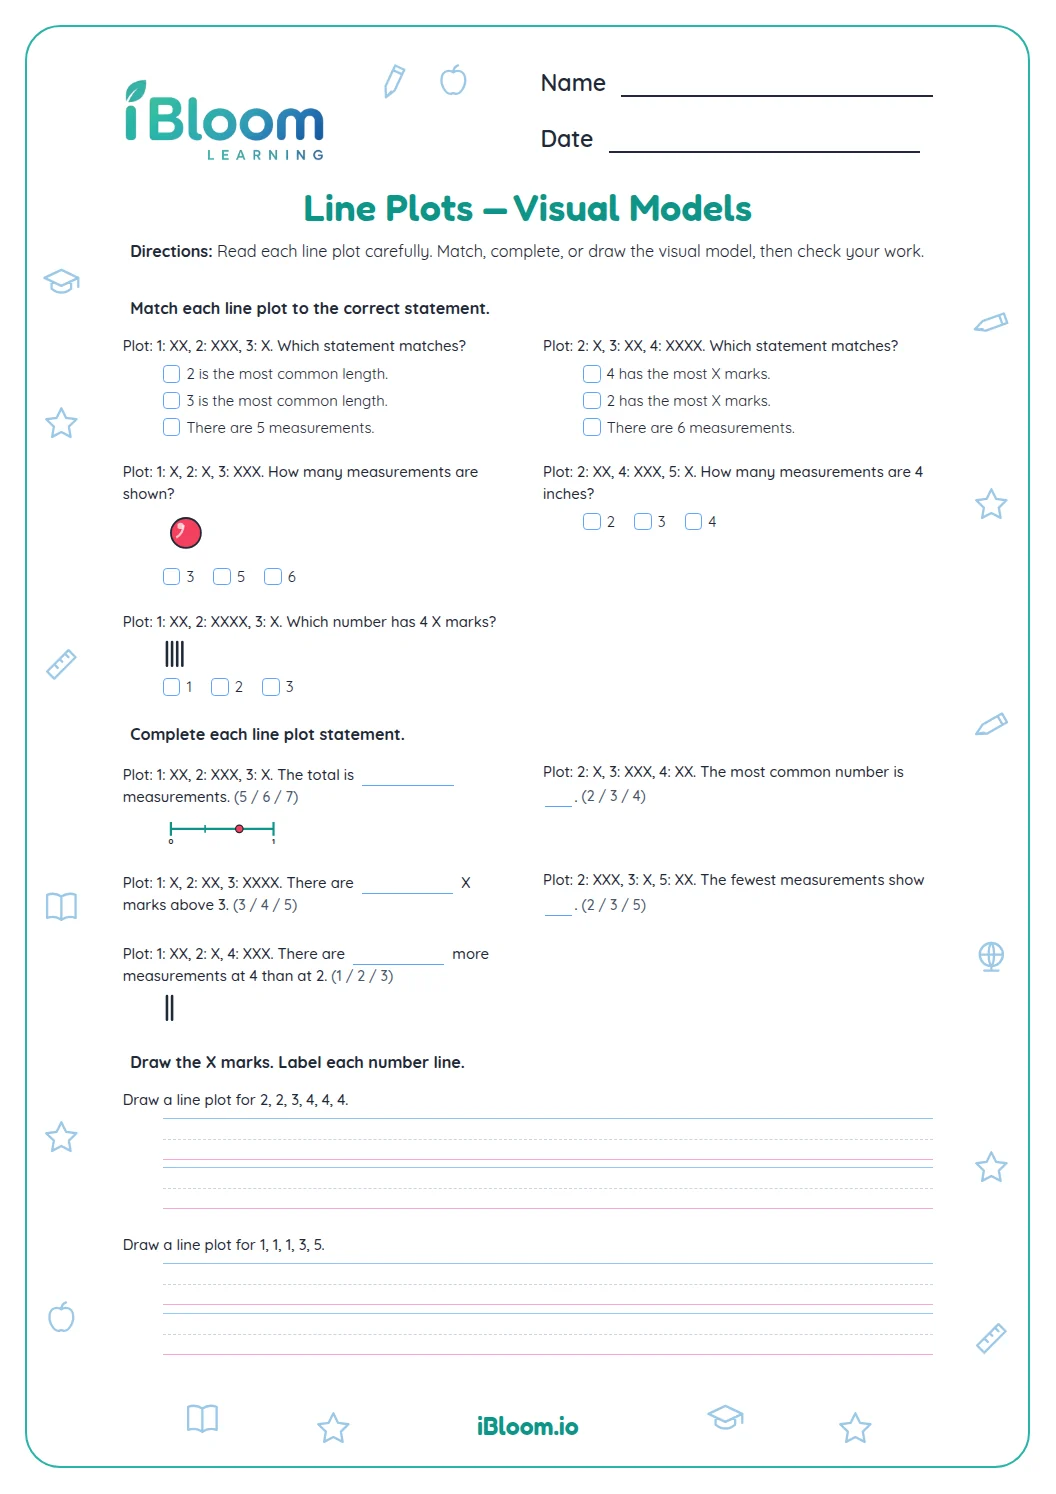
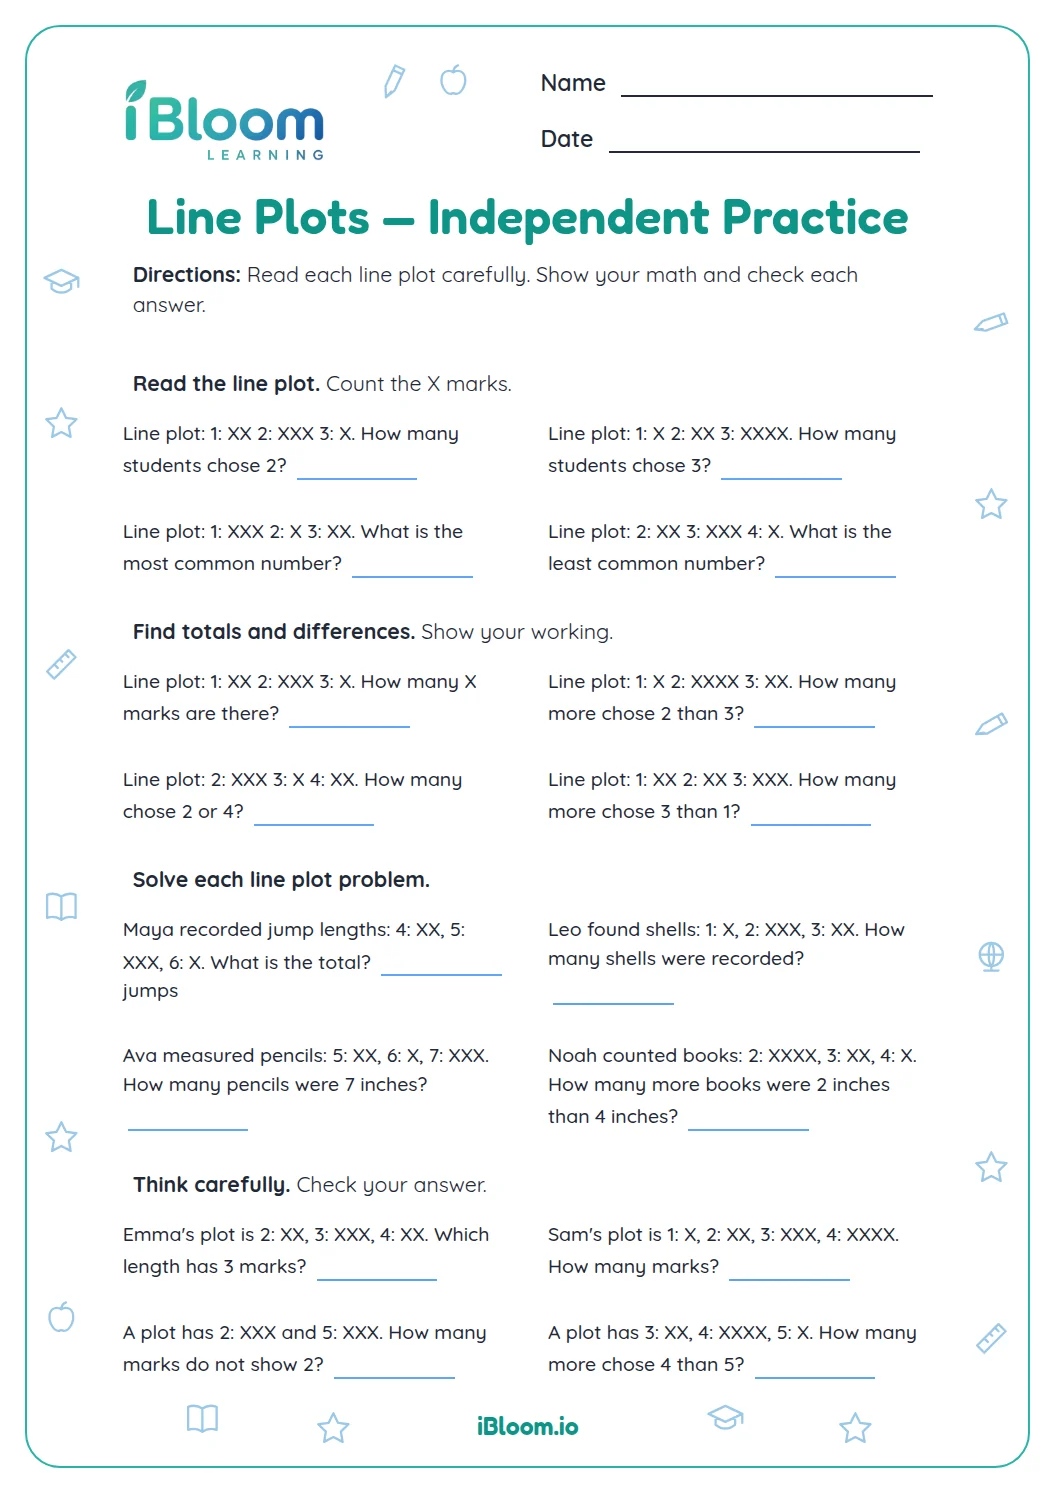
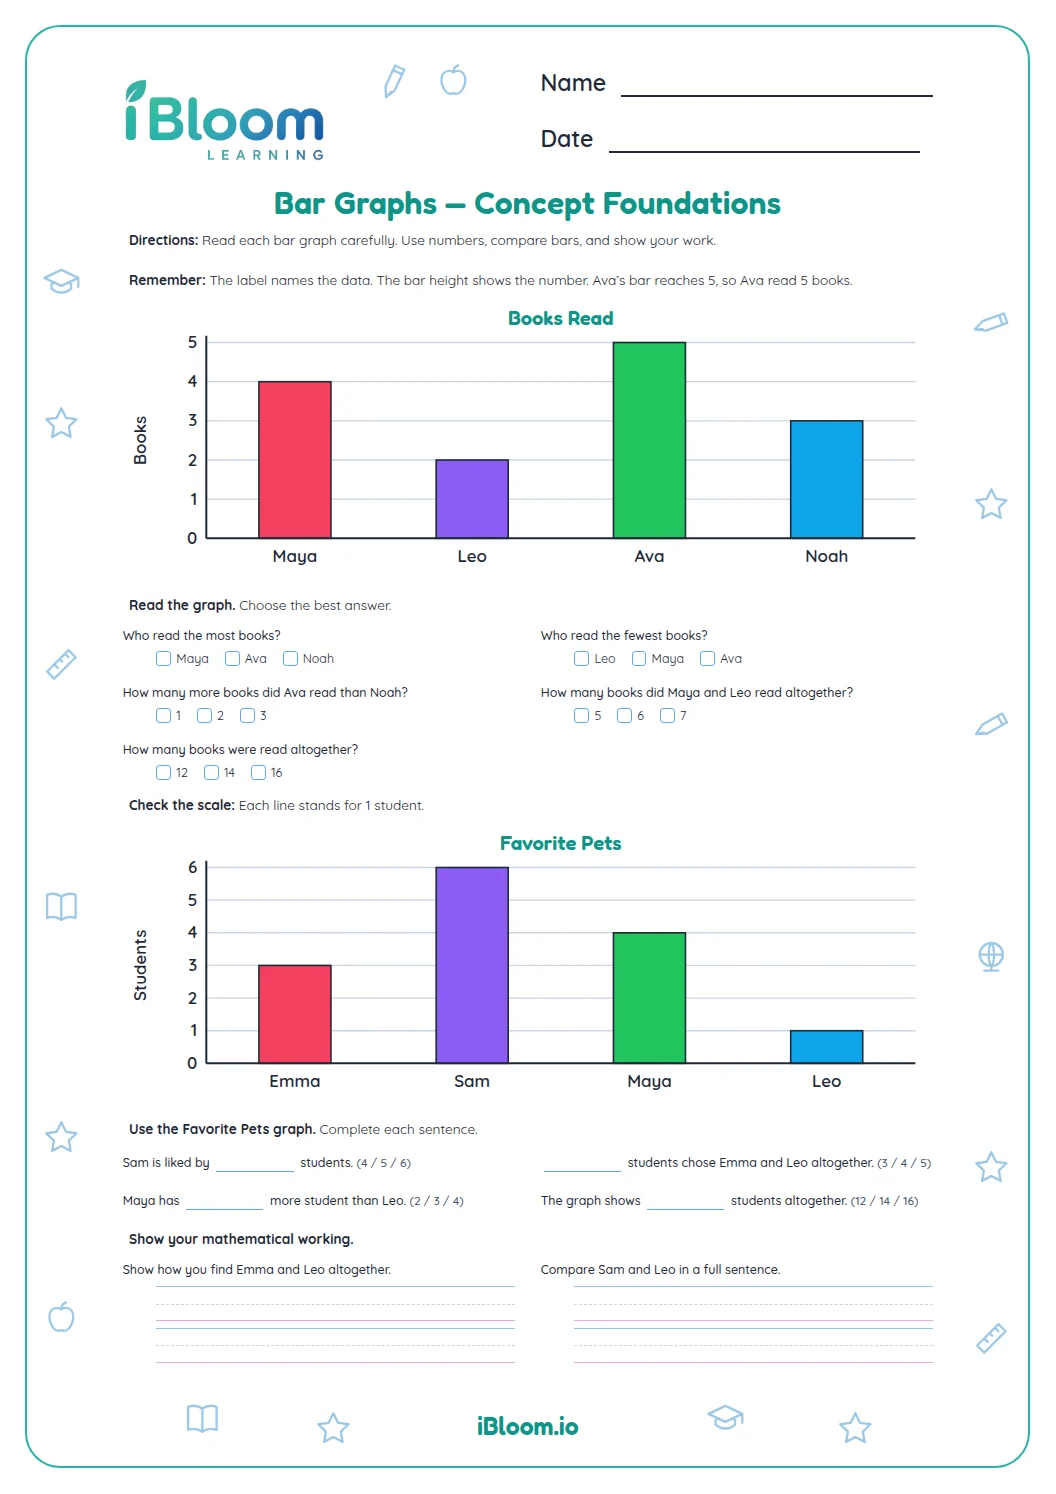
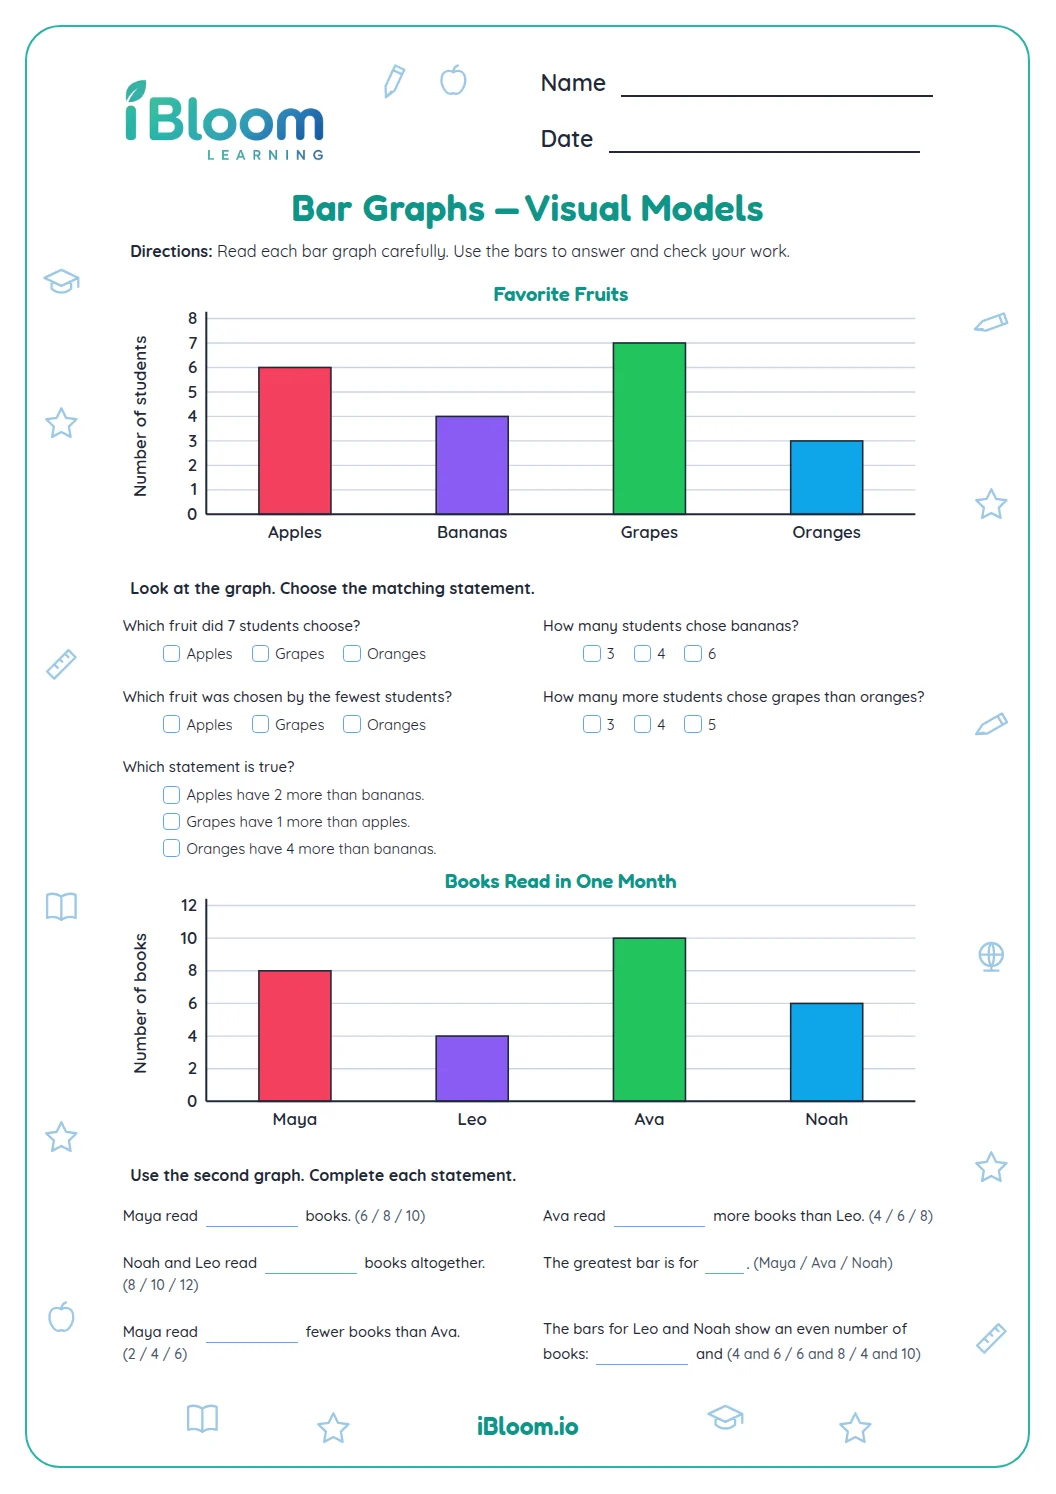
Each X marks one observation at the value beneath it. Count the marks in a column to find how many measurements match that value.
- 1Ribbon plot: 1 inch has 2 X marks.
- 2There are 8 X marks altogether, so 8 ribbons were measured.
How can students solve the story problems?
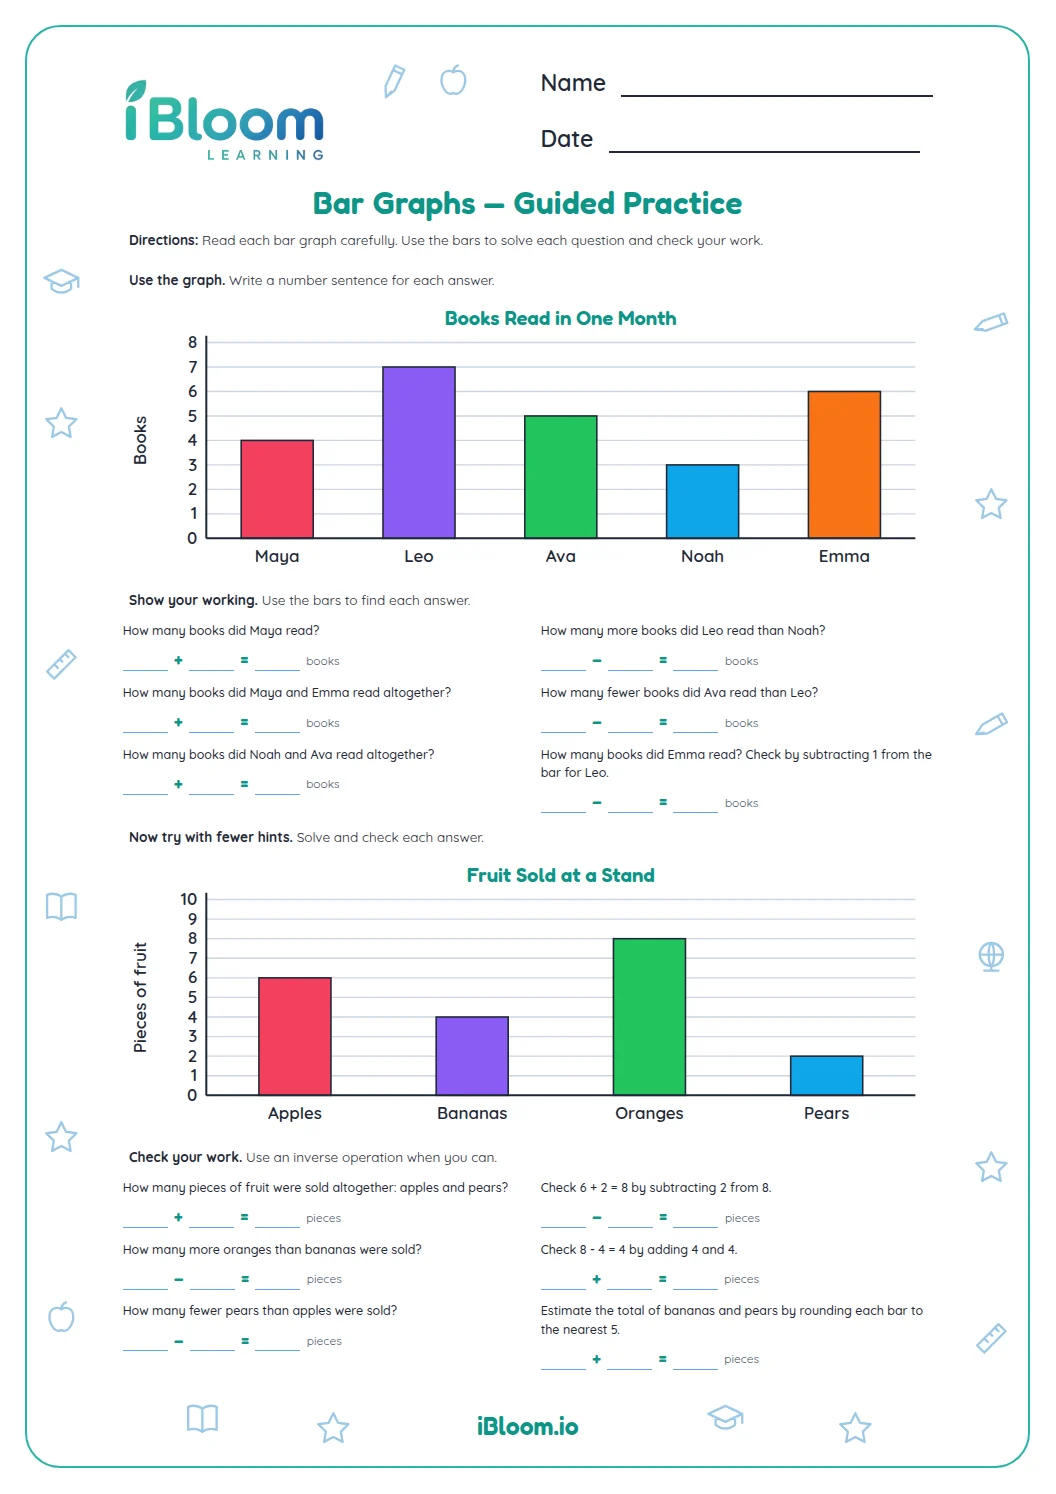
The ten story problems are separate from the plots. Identify whether the story combines amounts or describes items taken away, then choose addition or subtraction. Keep the named unit in the answer.
How can subtraction show what remains?
Start with the total amount, then subtract what was taken away. If students borrow 21 books from 58, 58 − 21 = 37 books remain.
- 158 books − 21 borrowed = 37 books remain.
How can students check their answers?
Keep the unit from the story: ribbons, students, cups, books, or feet. Recount the relevant marks before writing the final number.
How to use this worksheet
- 1Find the value labels along each number line.
- 2Count the X marks above the value named in each plot question.
- 3For a story problem, identify what is combined or taken away.
- 4Choose addition or subtraction from the situation.
- 5Write the number and its unit.
- 6Check the answer against the story or plot.
Common mistakes and quick fixes
The mistake
Counting the value labels instead of the X marks.
The fix
Each X is one observation; a label gives the measurement, not the count.
The mistake
Subtracting the amount borrowed from itself instead of from the starting total.
The fix
Start with all 58 books and subtract the 21 borrowed to find the amount left.
The mistake
Leaving off the unit in a story answer.
The fix
Include the named unit, such as 6 books or 2 feet.
Common Core alignment
This practice connects the listed standard to the skill on the page.
Solve addition and subtraction story problems within 100.
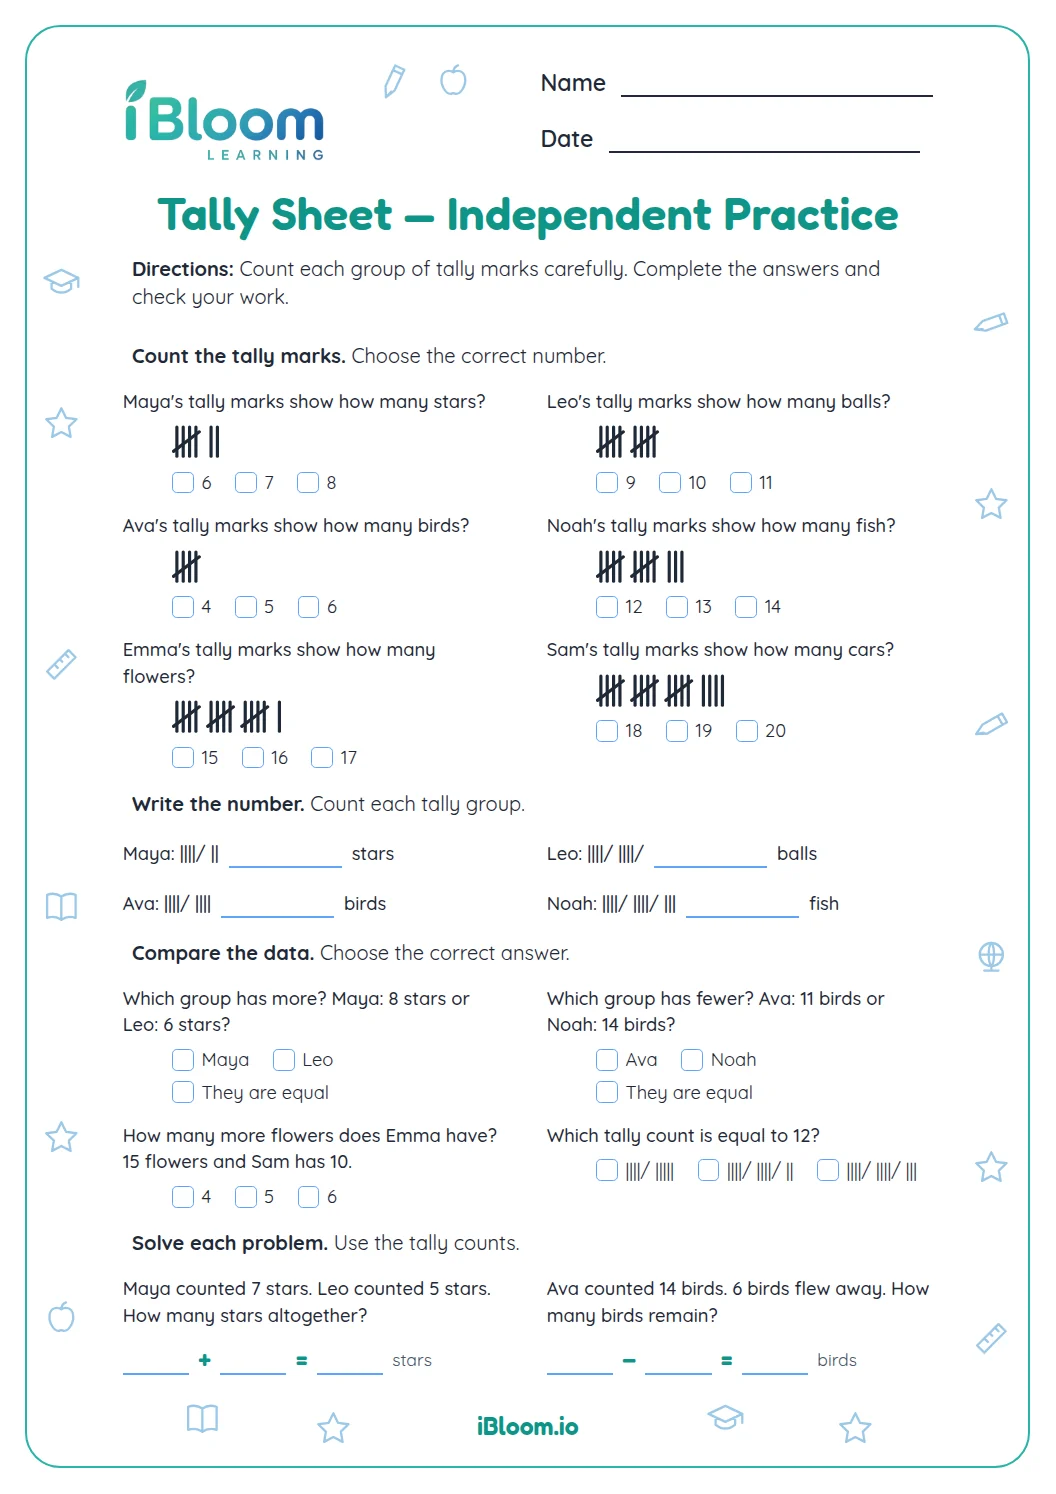
On this sheet: Part B has ten addition and subtraction story problems with totals and amounts left within 100.
Show the official wordingHide the official wording
Use addition and subtraction within 100 to solve one- and two-step word problems involving situations of adding to, taking from, putting together, taking apart, and comparing, with unknowns in all positions, e.g., by using drawings and equations with a symbol for the unknown number to represent the problem.
What to practice next
Make more practice
Further reading
Questions parents and teachers ask
What does each X mean on a line plot?
Each X represents one measurement or response. To find how many observations have a certain value, count the X marks above that number. The labels show the values being measured, such as inches, books, cups, or feet, and each X stands for one record.
How many questions are included?
There are 14 questions: four ask students to read a count from a line plot, and ten ask them to solve an addition or subtraction story. The answer key gives the result for every item and supports a quick check.
Do students need to add or subtract?
Yes. The first four questions ask students to read a count from a line plot. The ten story problems that follow use addition or subtraction to find totals and amounts left, such as books borrowed or flowers in a garden.
Why are four different line plots included?
Each plot gives students a new data set to read: ribbon lengths, books read, cups of water, or jump lengths. They count the X marks above one named value in each plot, then move on to separate addition and subtraction stories.
How should students write a story answer?
Write the number and the unit named in the question, such as 8 ribbons, 6 books, or 2 feet. Before finishing, point to the X marks for a plot question or identify the quantities in the story, then check that the answer fits.