



About this worksheet
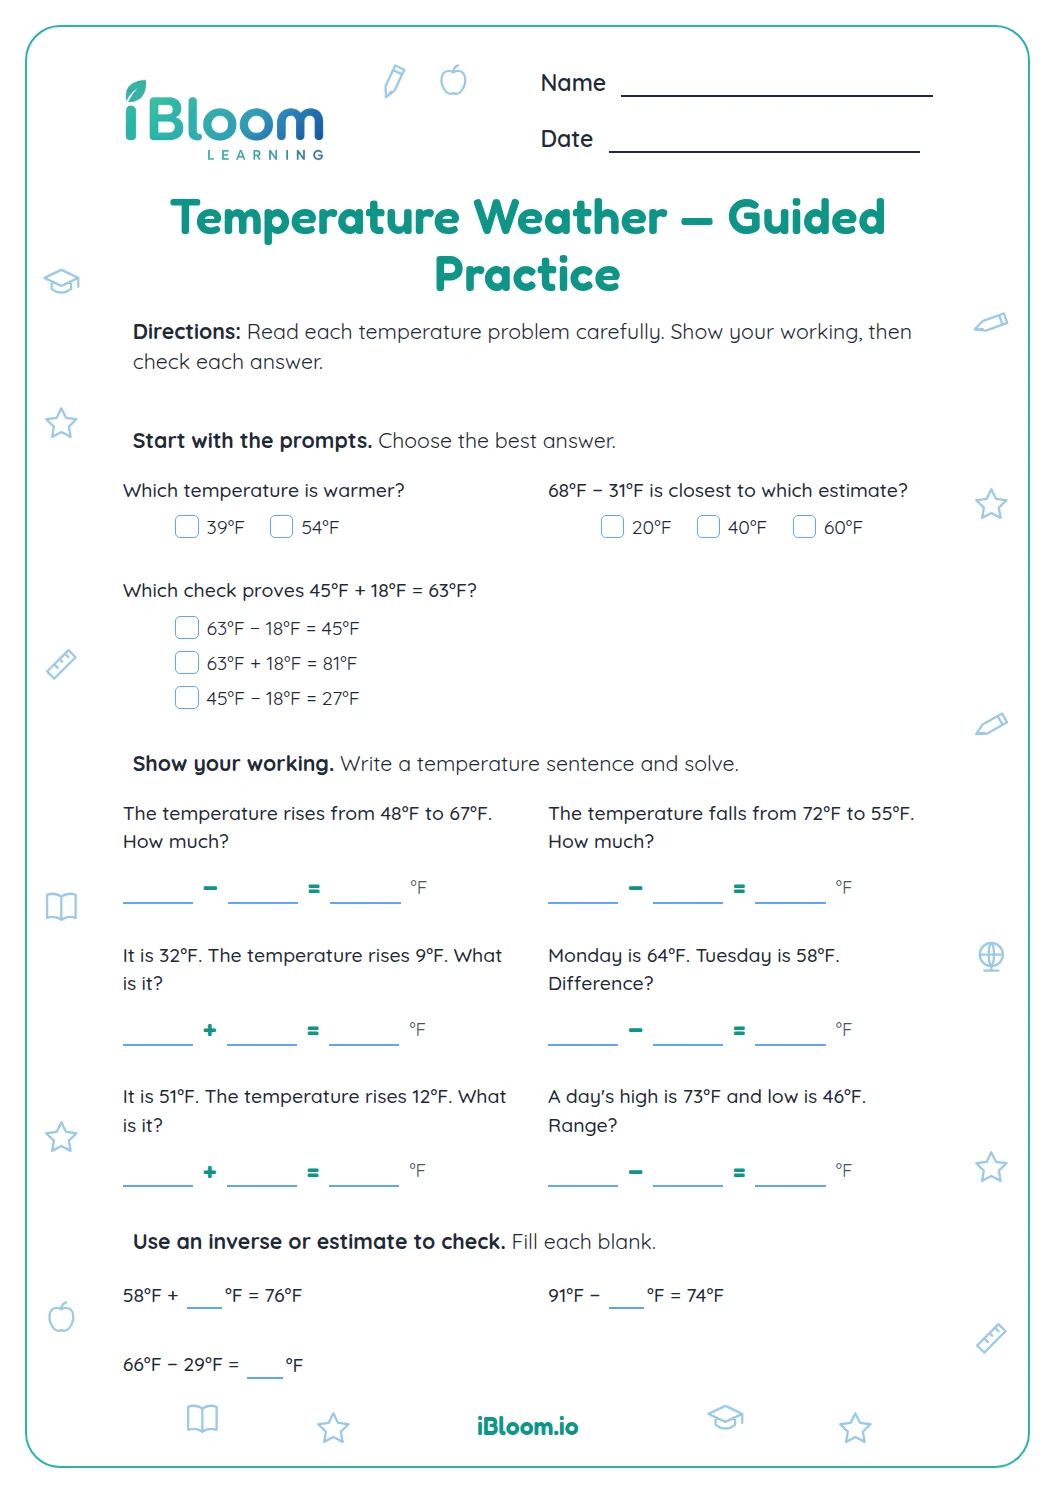
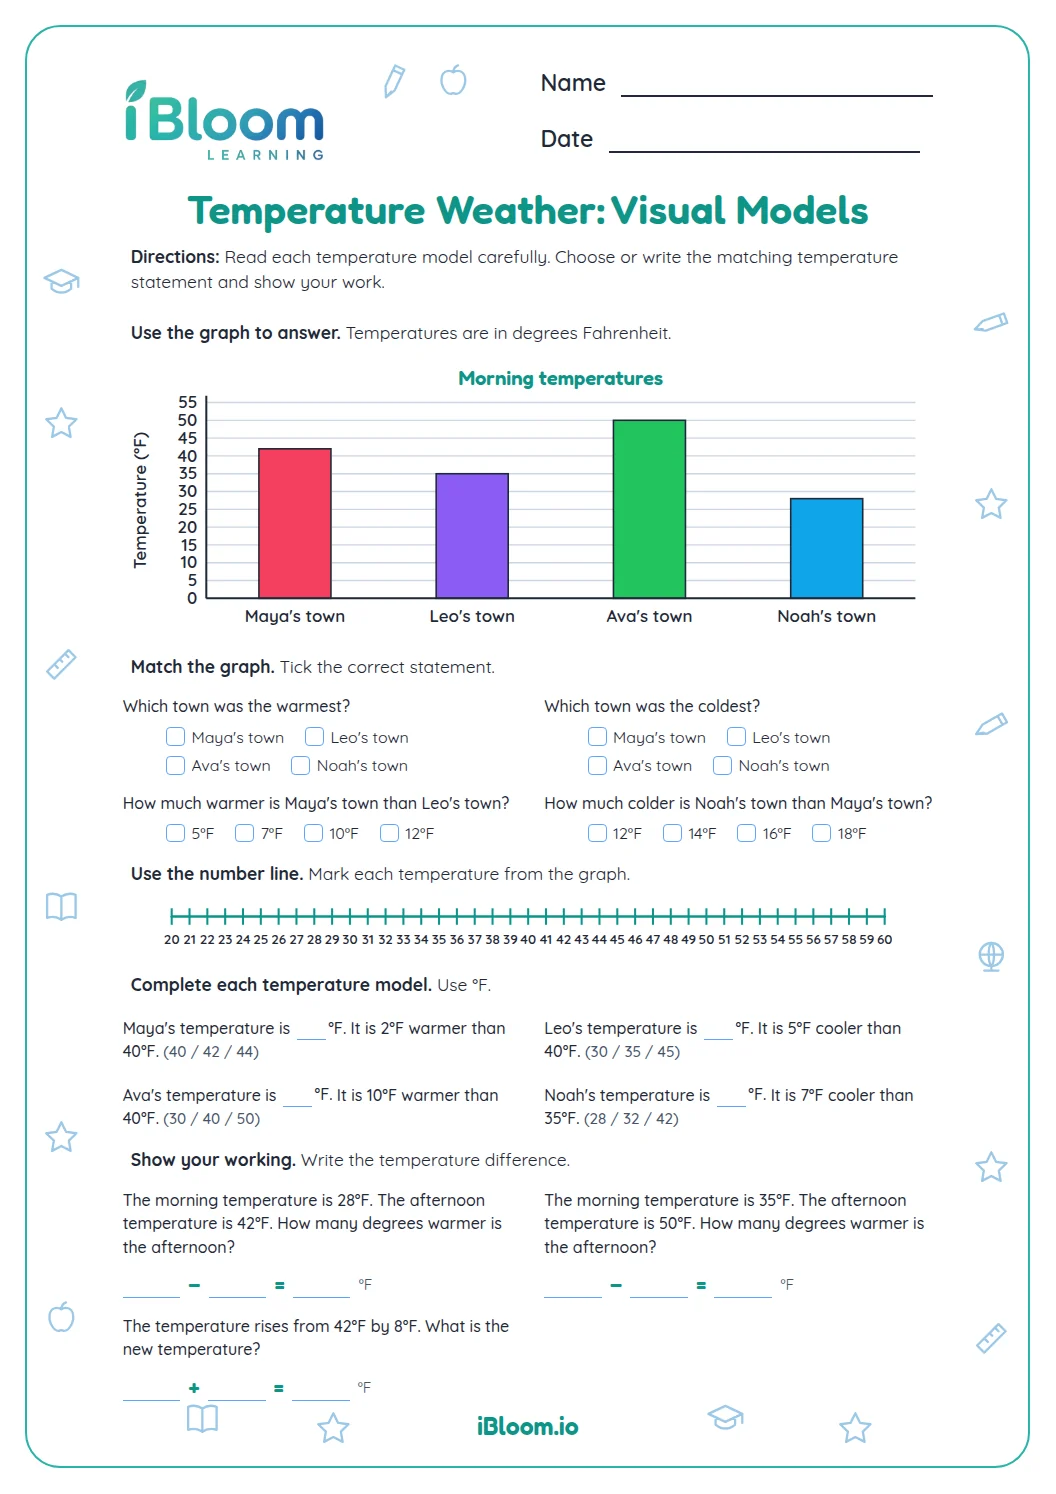
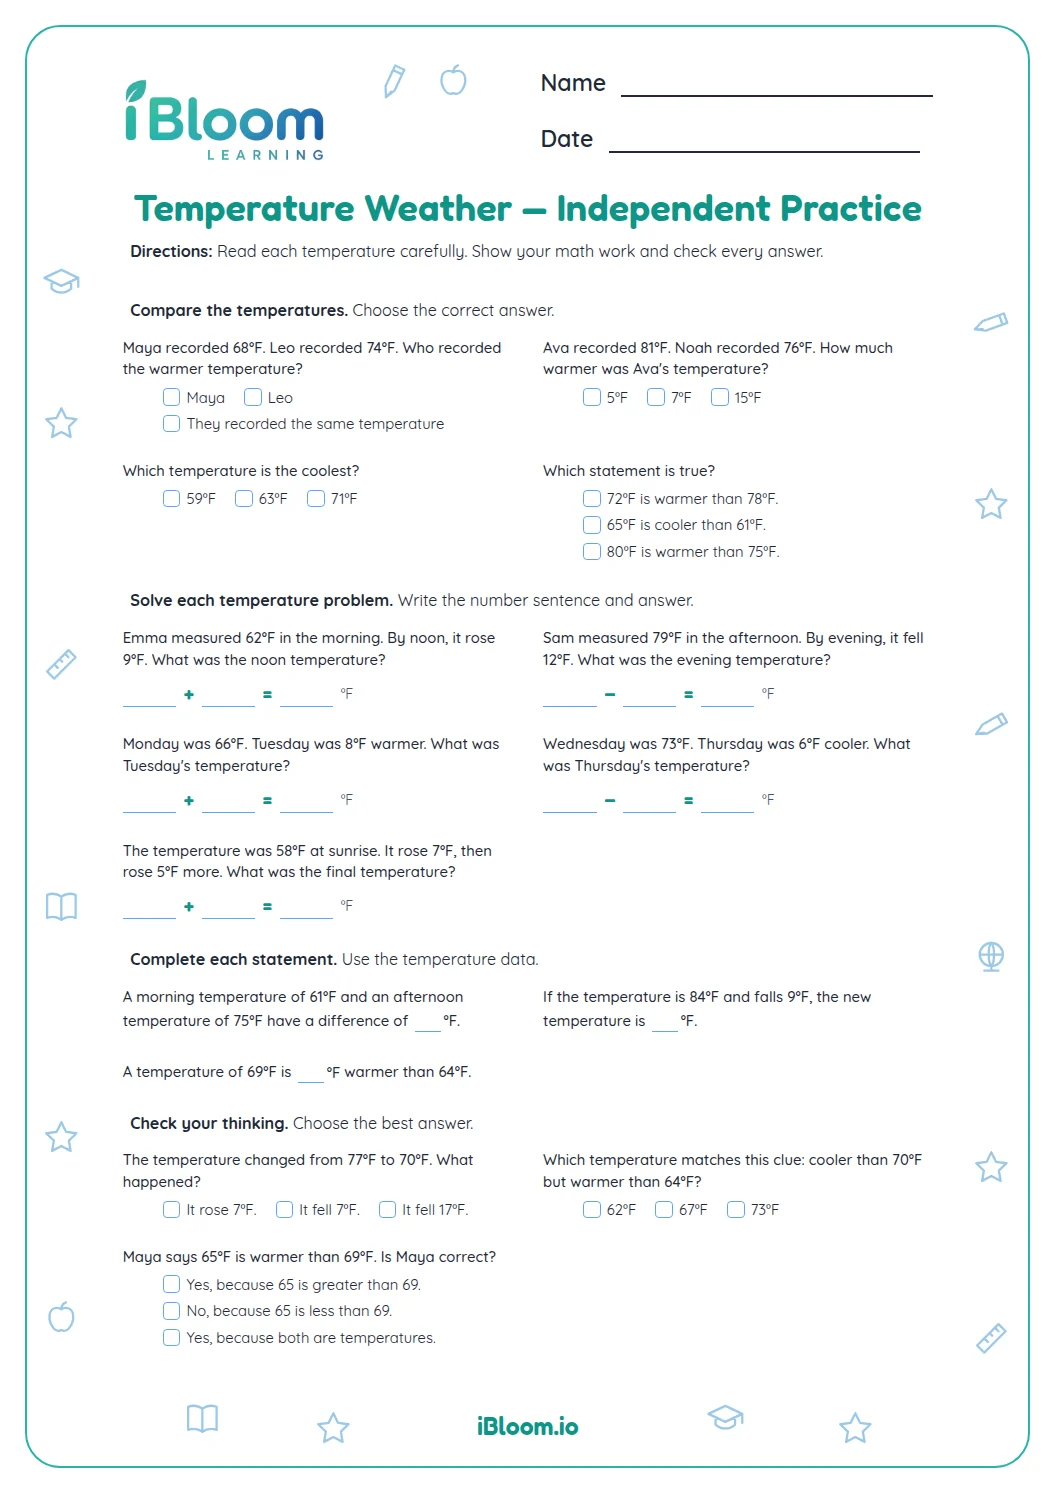
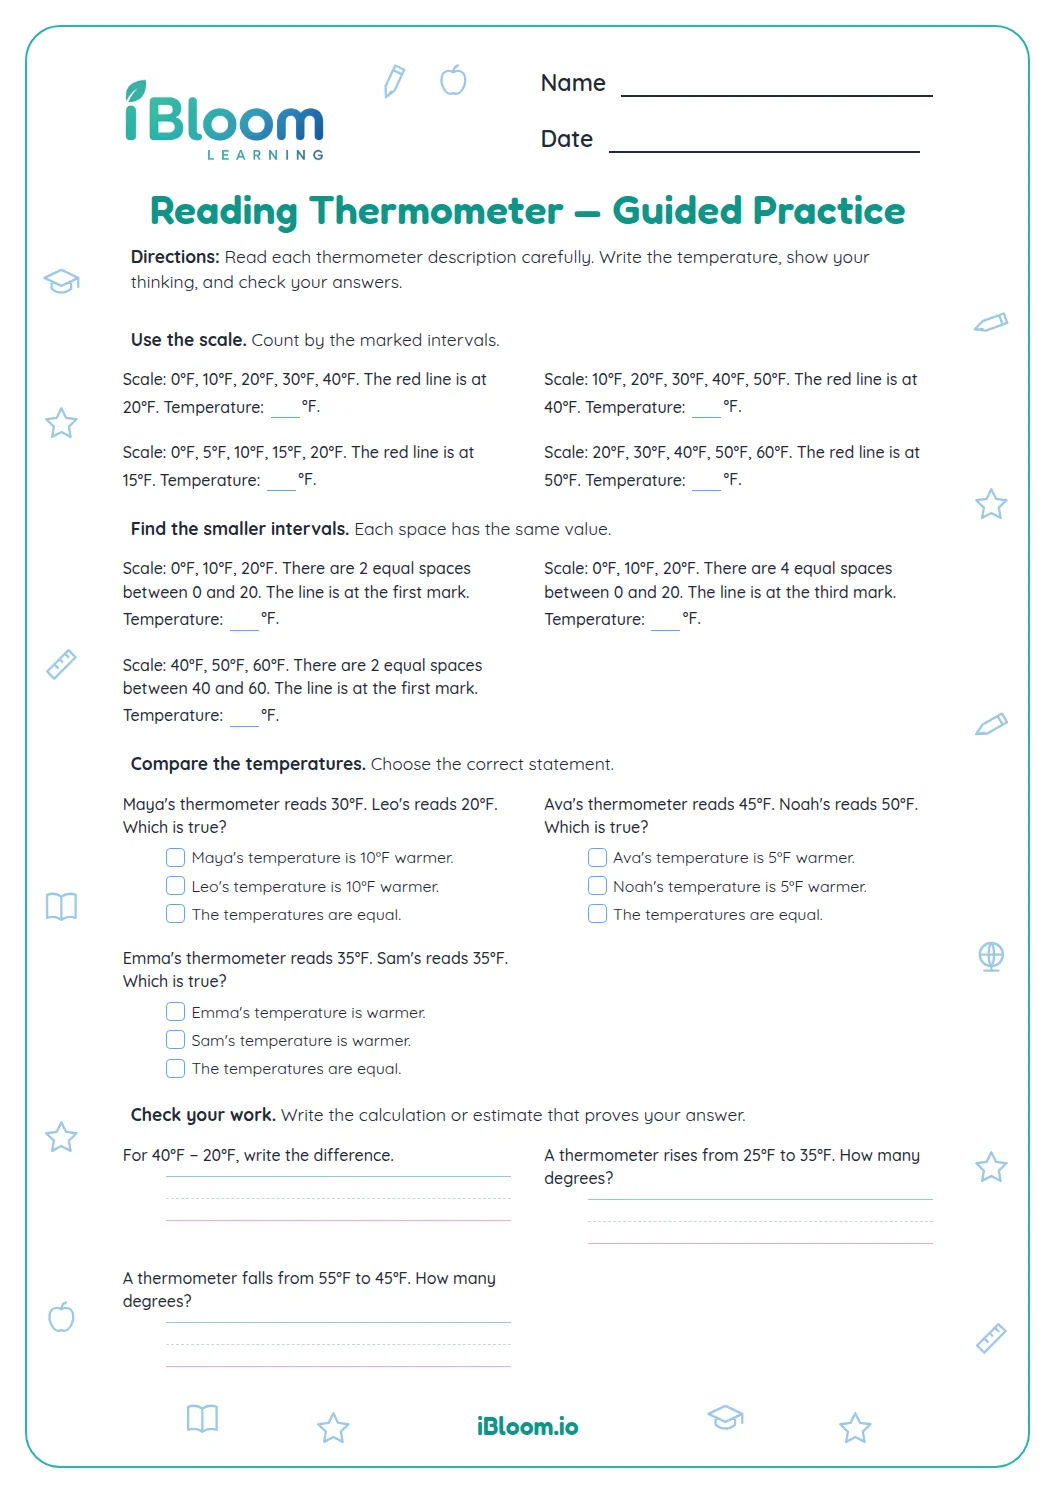
This free Grade 3 worksheet connects Fahrenheit weather readings with comparison and subtraction. Learners identify the thermometer and degree unit, compare values, read an afternoon temperature graph, and solve four rise-and-drop stories. Its 14 questions move from vocabulary and graph reading to written calculations, with a separate answer key. The graph questions practice CCSS 3.MD.B.3 by asking children to read data and compare how many degrees warmer or cooler one day is.
Aligned to 3.MD.B.3
How do you compare two temperatures?
First check that both readings use the same unit. A larger Fahrenheit number is warmer; to find the difference, subtract the smaller reading from the larger one. The graph on this sheet shows 18°F on Tuesday and 12°F on Monday, so 18 − 12 = 6°F.
- 1Tuesday is 18°F and Monday is 12°F.
- 218 − 12 = 6°F
- 3Tuesday was 6°F warmer.
What does each part practice?
The questions begin with the thermometer, Fahrenheit, and warmer or colder comparisons. The next part uses one bar-graph model and short temperature sentences; the final part asks learners to calculate changes in four weather stories.
- Part A: name temperature tools and compare readings
- Part B: read a bar graph and complete temperature sentences
- Part C: solve four rise-and-drop stories
How can an adult support the story problems?
Ask whether the temperature went up or down before choosing an operation. Have the learner label the starting and ending readings, then check the difference by adding it back.
How to use this worksheet
- 1Name the unit before comparing readings.
- 2Read the graph labels and values carefully.
- 3For a rise or drop, subtract the two readings.
- 4Check a difference by adding it to the smaller reading.
Common mistakes and quick fixes
The mistake
Calling a larger Fahrenheit number colder.
The fix
Compare the readings on the same scale: 18°F is warmer than 12°F.
The mistake
Subtracting the ending reading from the starting reading in a rise question.
The fix
Find the distance between the two values; 20 − 12 = 8 degrees.
The mistake
Forgetting the unit in a story answer.
The fix
Write the number of degrees and include °F or “degrees.”
Curriculum alignment
The graph questions ask learners to read and compare values in a data display.
Read a bar graph and answer comparison questions using its data.
On this sheet: Learners read daily temperature values and solve how-many-degrees-warmer-or-cooler comparisons from the graph.
Show the official wordingHide the official wording
Draw a scaled picture graph and a scaled bar graph to represent a data set with several categories. Solve one- and two-step “how many more” and “how many less” problems using information presented in scaled bar graphs.
What to practice next
Make more practice
Further reading
Questions parents and teachers ask
What tool measures temperature?
A thermometer measures temperature. The worksheet begins by asking children to identify that tool and recognize Fahrenheit as a common US weather unit. The graph and story questions then use Fahrenheit readings, so learners can apply the vocabulary as they compare warmer and cooler days.
How do you find the difference between two temperatures?
Subtract the smaller reading from the larger reading to find the number of degrees between them. For Monday at 12°F and Tuesday at 18°F, calculate 18 − 12 = 6°F. The worksheet asks learners to use the same idea in graph questions and weather stories.
What does the weather graph show?
The bar graph lists afternoon temperatures for Monday through Thursday: 12°F, 18°F, 15°F, and 23°F. Children identify the warmest day, compare two readings, and order three days from coldest to warmest. The graph gives the data needed for each response.
Can the worksheet be used without a thermometer?
Yes. It uses printed Fahrenheit values and a bar graph, so no physical thermometer is needed. A real thermometer can be an optional conversation starter, but learners can complete every question using the worksheet and answer key. Ask the learner to explain the step and point to the matching question before checking the answer key.
What is included in the answer key?
The separate key gives the thermometer and unit answers, the graph comparisons, and the temperature changes for all five stories. For a story problem, check both the subtraction and whether the response names the change in degrees. Ask the learner to explain the step and point to the matching question before checking the answer key.