
About this worksheet
This free printable worksheet gives Grade 2 learners focused practice with reading pie charts. The questions build from guided recognition to independent application, and a separate answer key supports review at home or in class. Use the section directions to work through the page one step at a time.
How do pie-chart slices show a fraction?
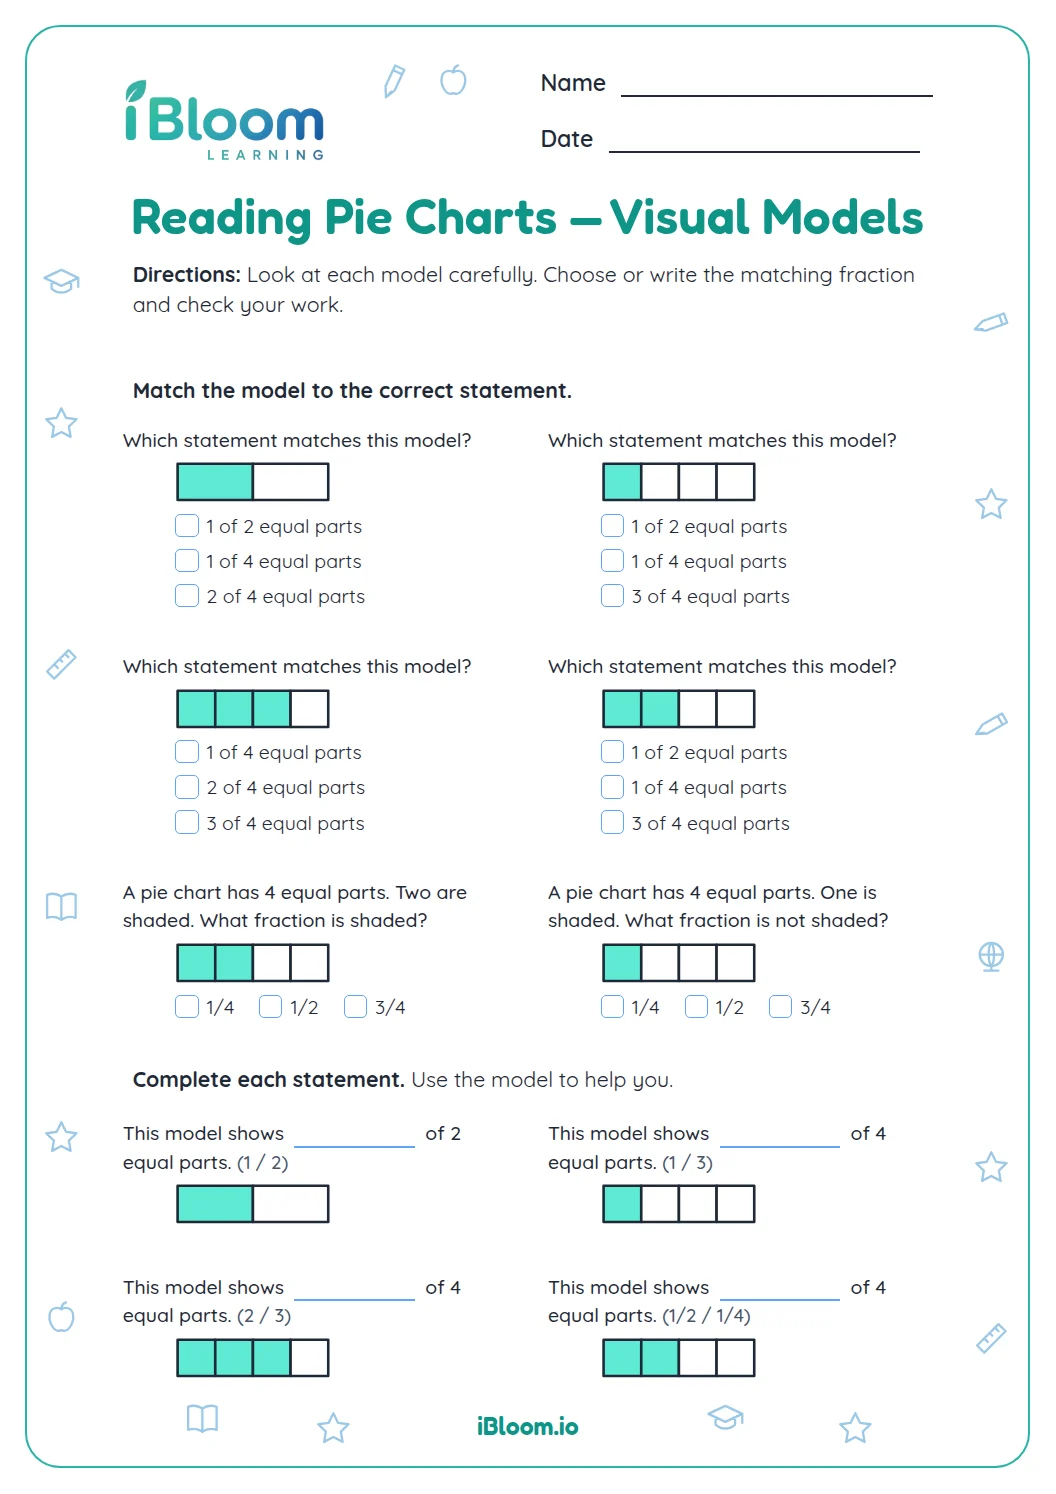
The denominator tells how many equal slices make the whole circle. The numerator tells how many slices belong to the selected category. In question 1, one of four equal slices is selected, so the share is 1/4.
How can a learner name the selected share?
Count the equal slices first, then count the selected slices. Keep the selected count on top and the total number of slices on the bottom. Questions use circles divided into halves, thirds, and fourths.
What is included in the printable?
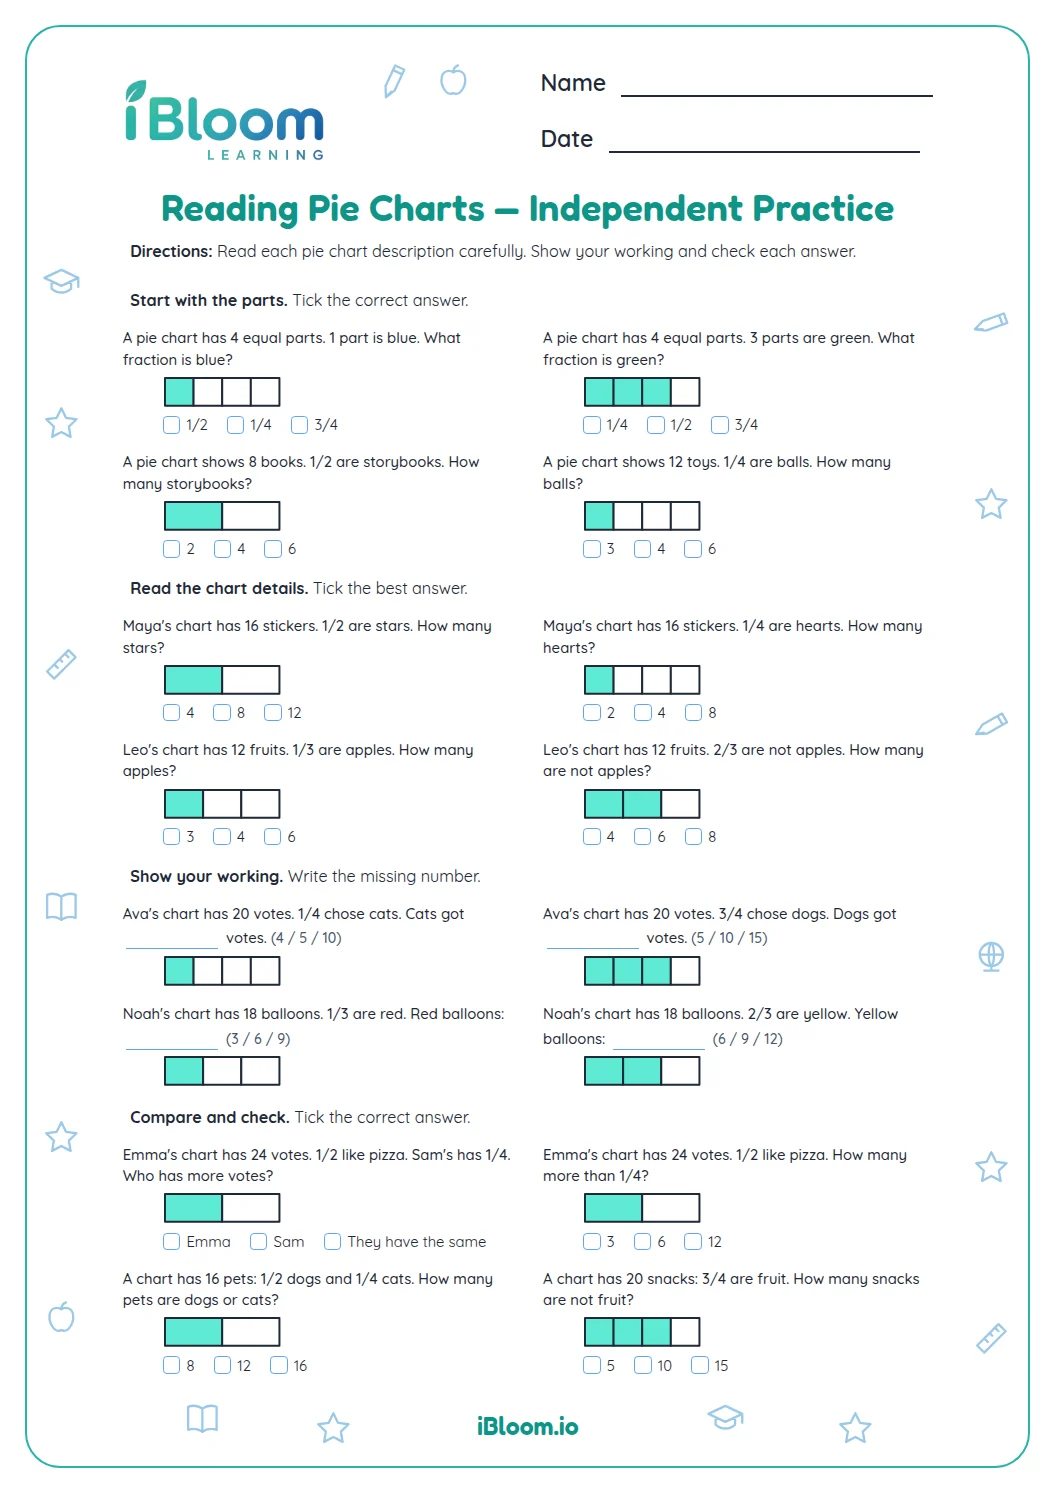
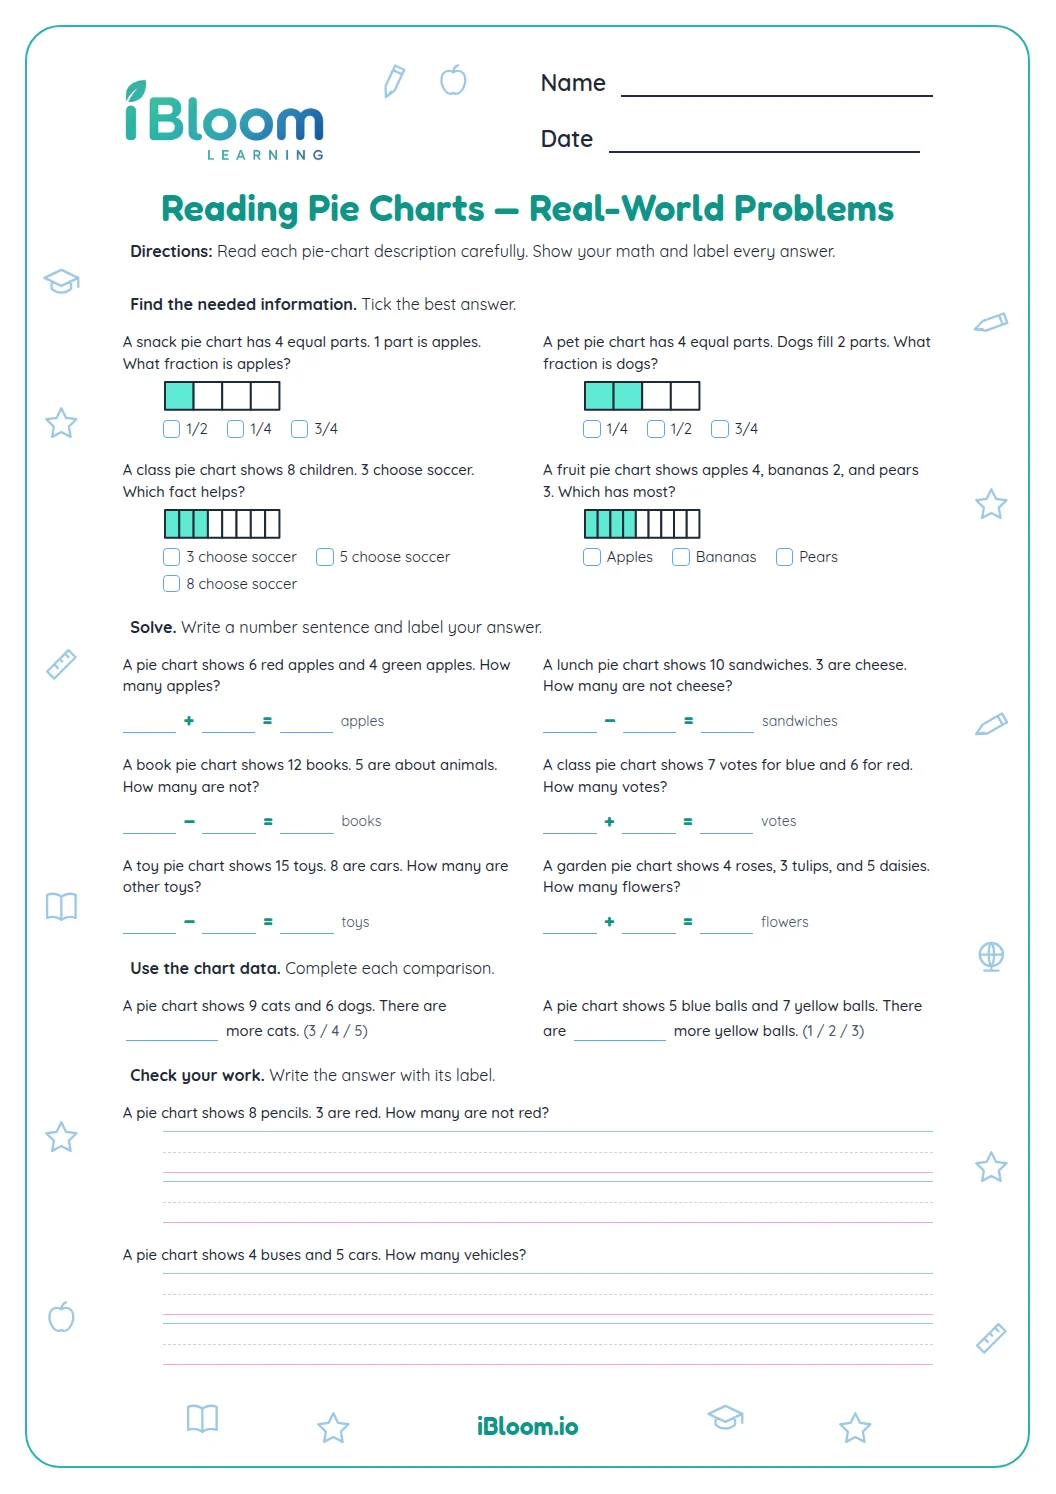
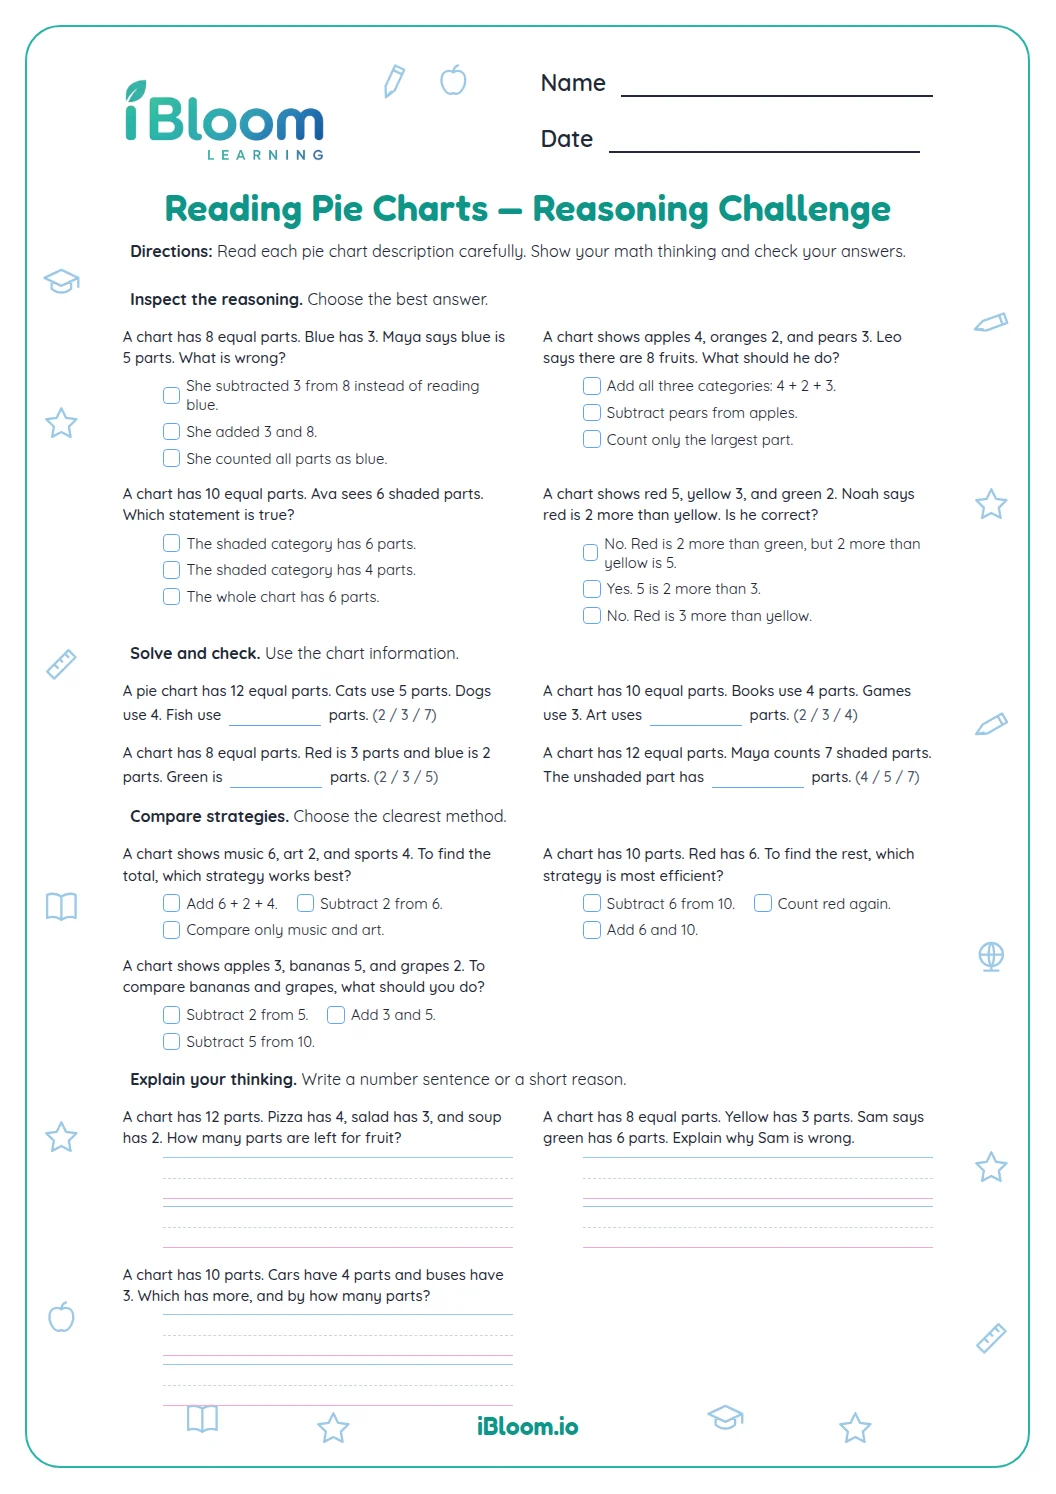
The sheet has 14 questions in three parts, with a separate answer key. Every item includes a circle divided into equal parts to connect the fraction to a pie-chart model.
How to use this worksheet
- 1Count all equal sections in the model to find the denominator.
- 2Count the shaded sections to find the numerator.
- 3Write the selected share as shaded parts over total parts.
- 4For a choice question, compare the numerator and denominator with the model.
- 5Check the fraction against the separate answer key.
Common mistakes and quick fixes
The mistake
Putting the total number of slices on top.
The fix
Put selected slices in the numerator and all equal slices in the denominator.
The mistake
Counting only selected slices and ignoring the whole circle.
The fix
Count every slice to determine the denominator.
The mistake
Treating unequal pieces as equal shares.
The fix
Check that the model divides the circle into equal slices.
What to practice next
Make more practice
Questions parents and teachers ask
What does a fraction mean in a pie chart?
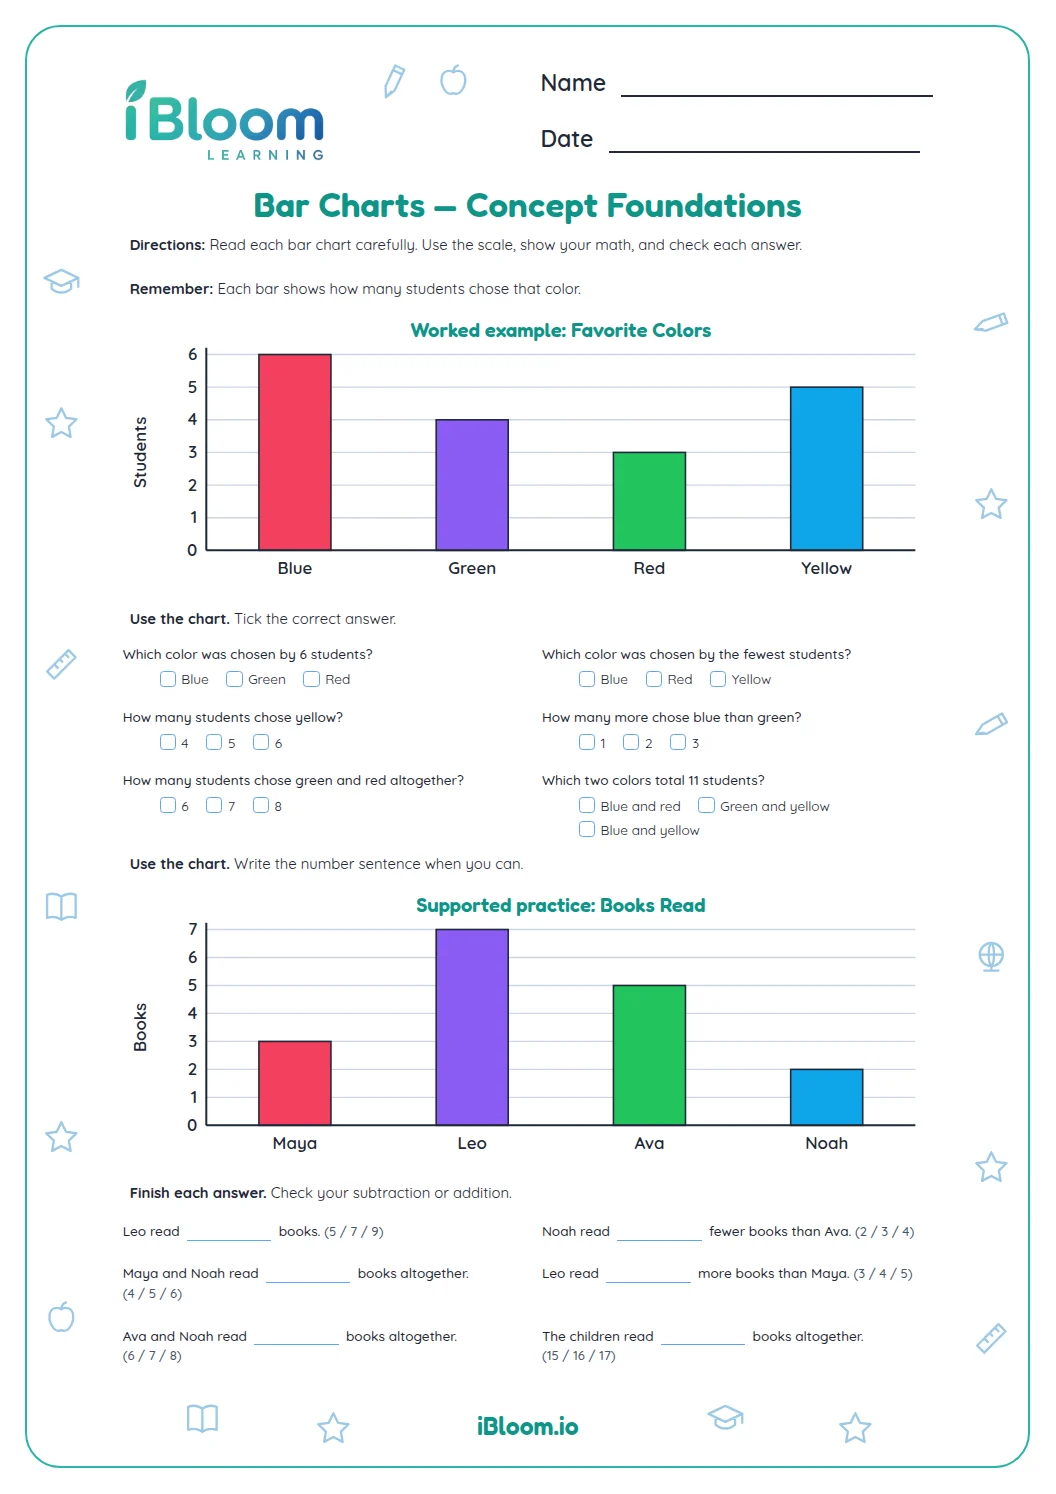
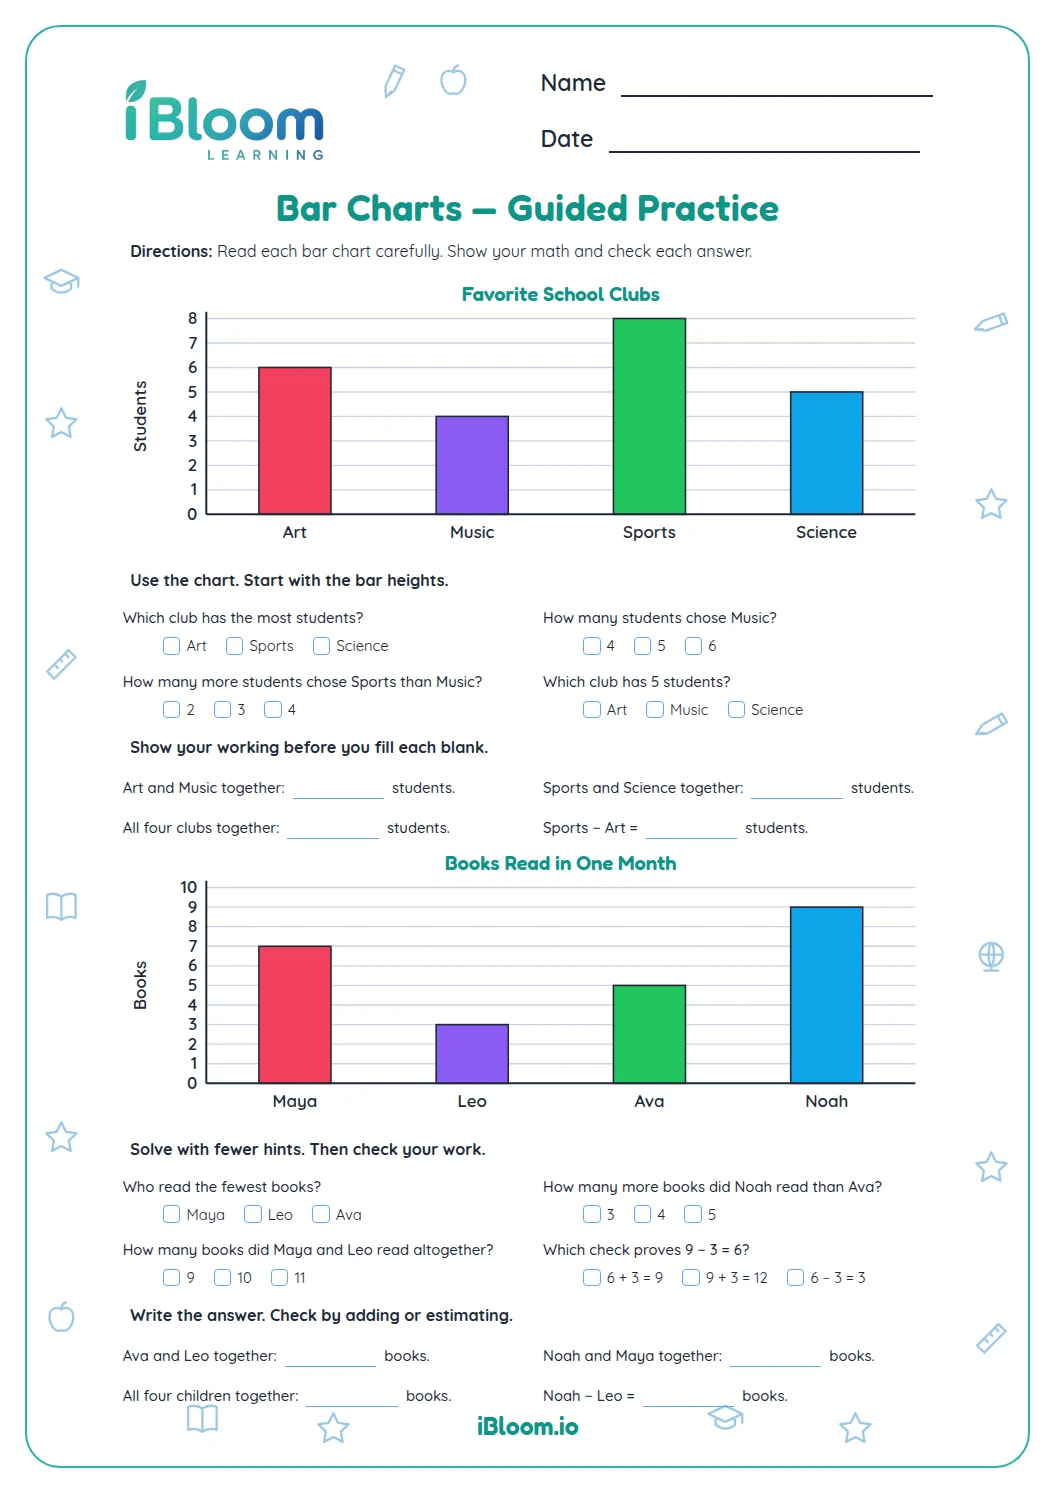
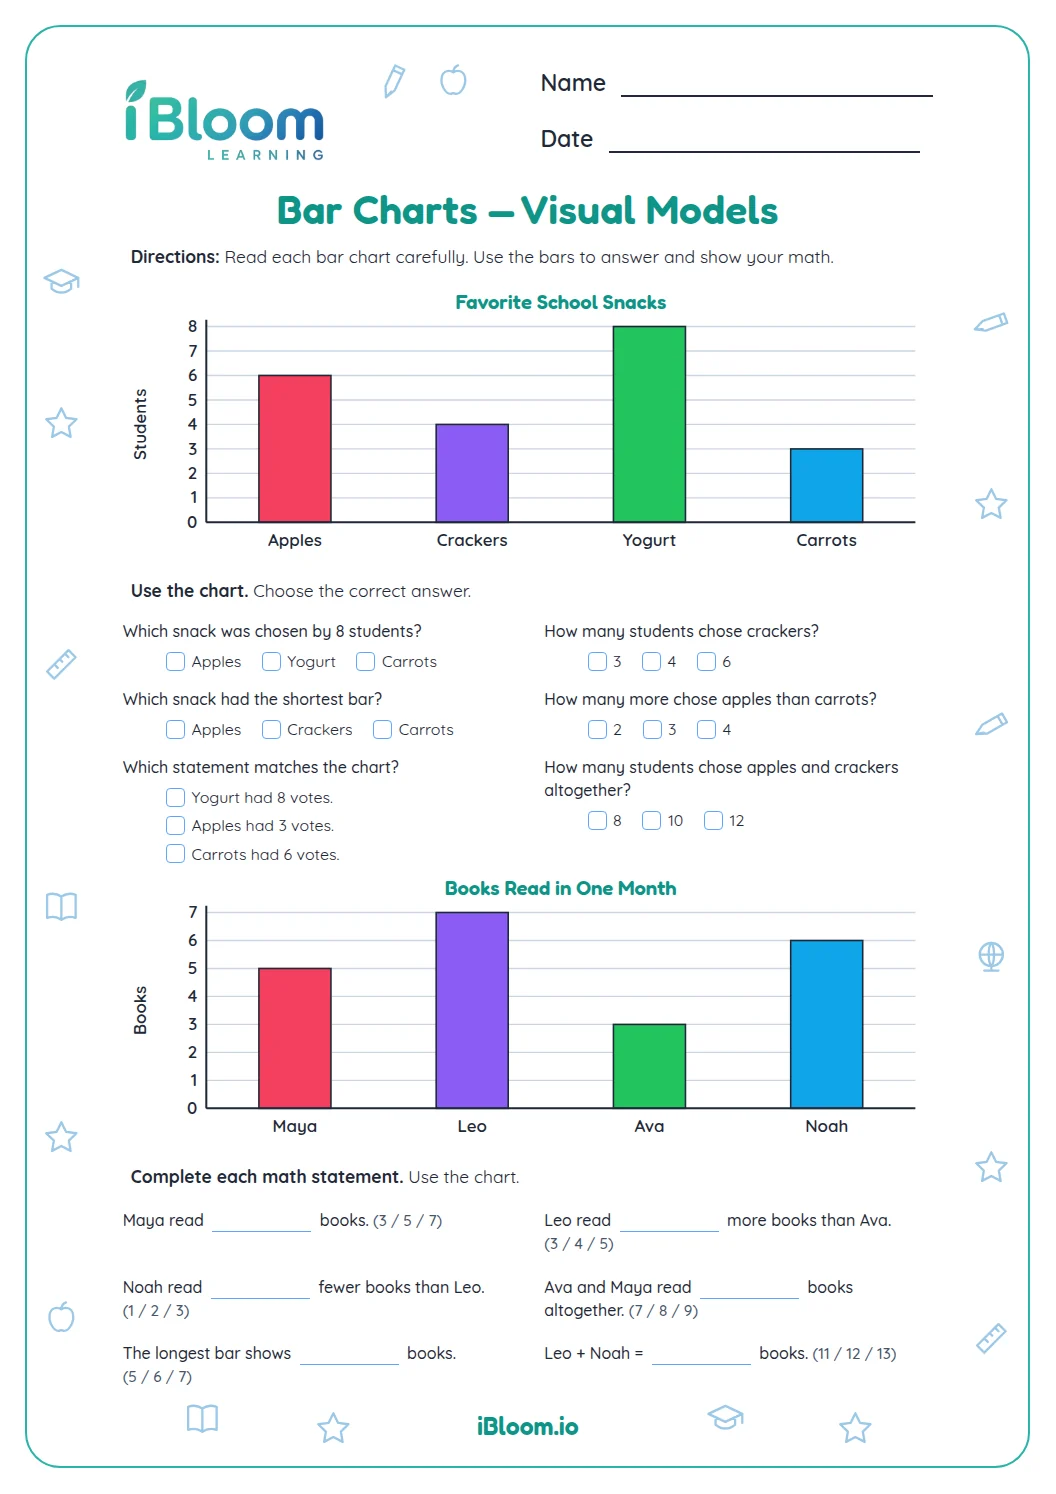
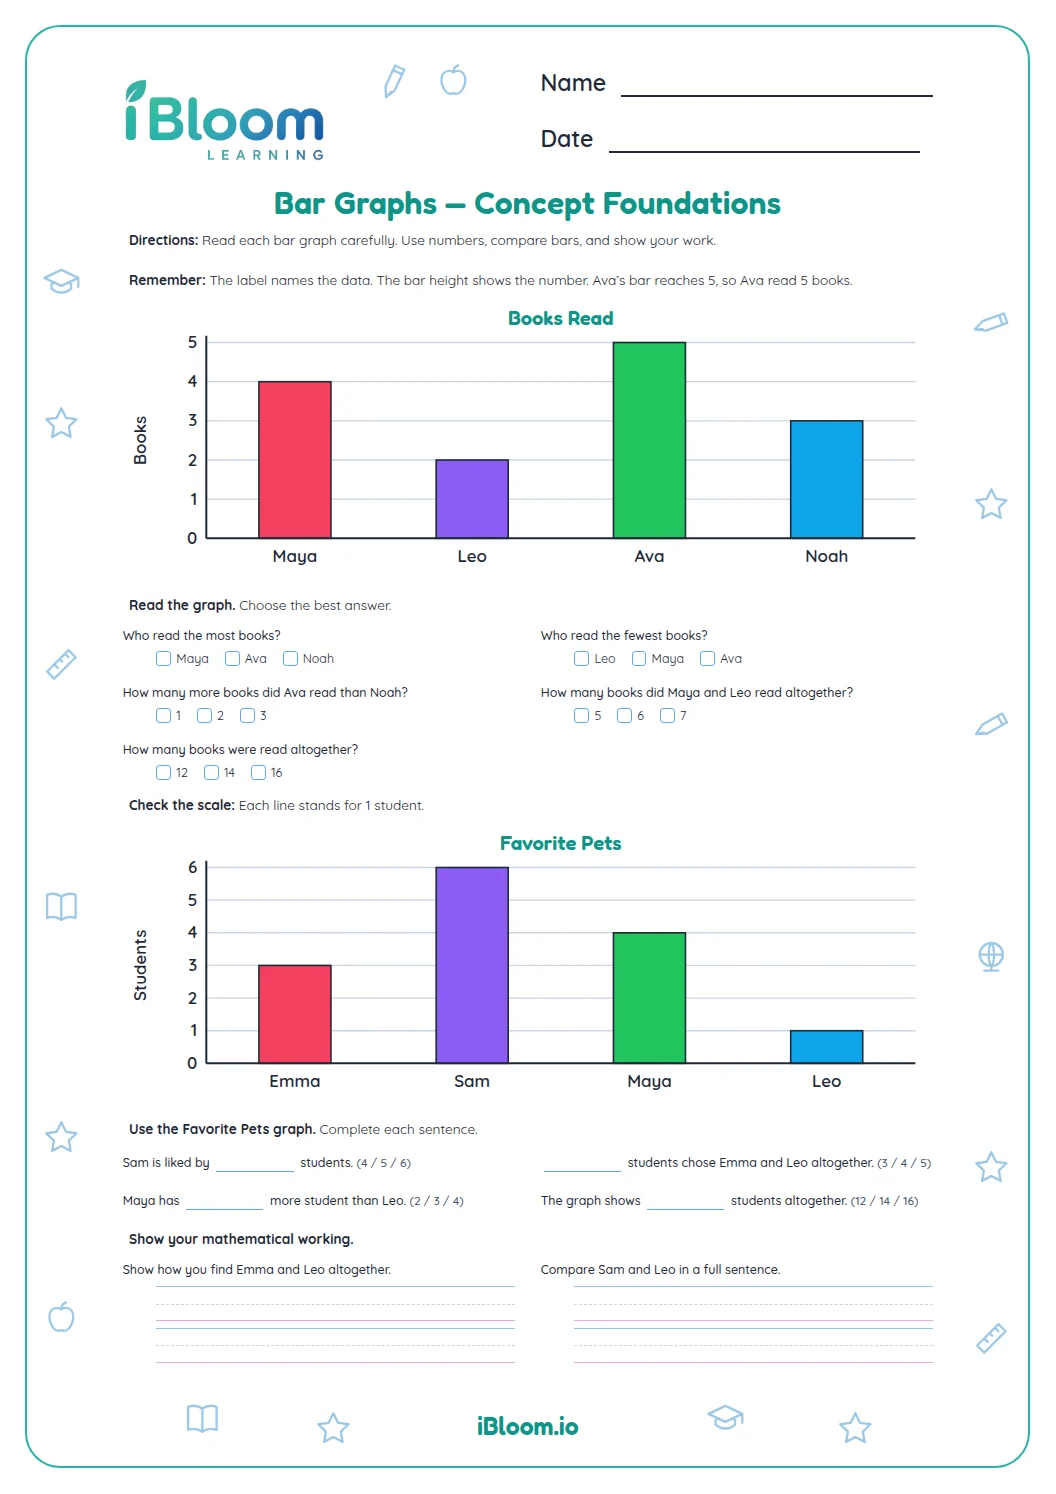
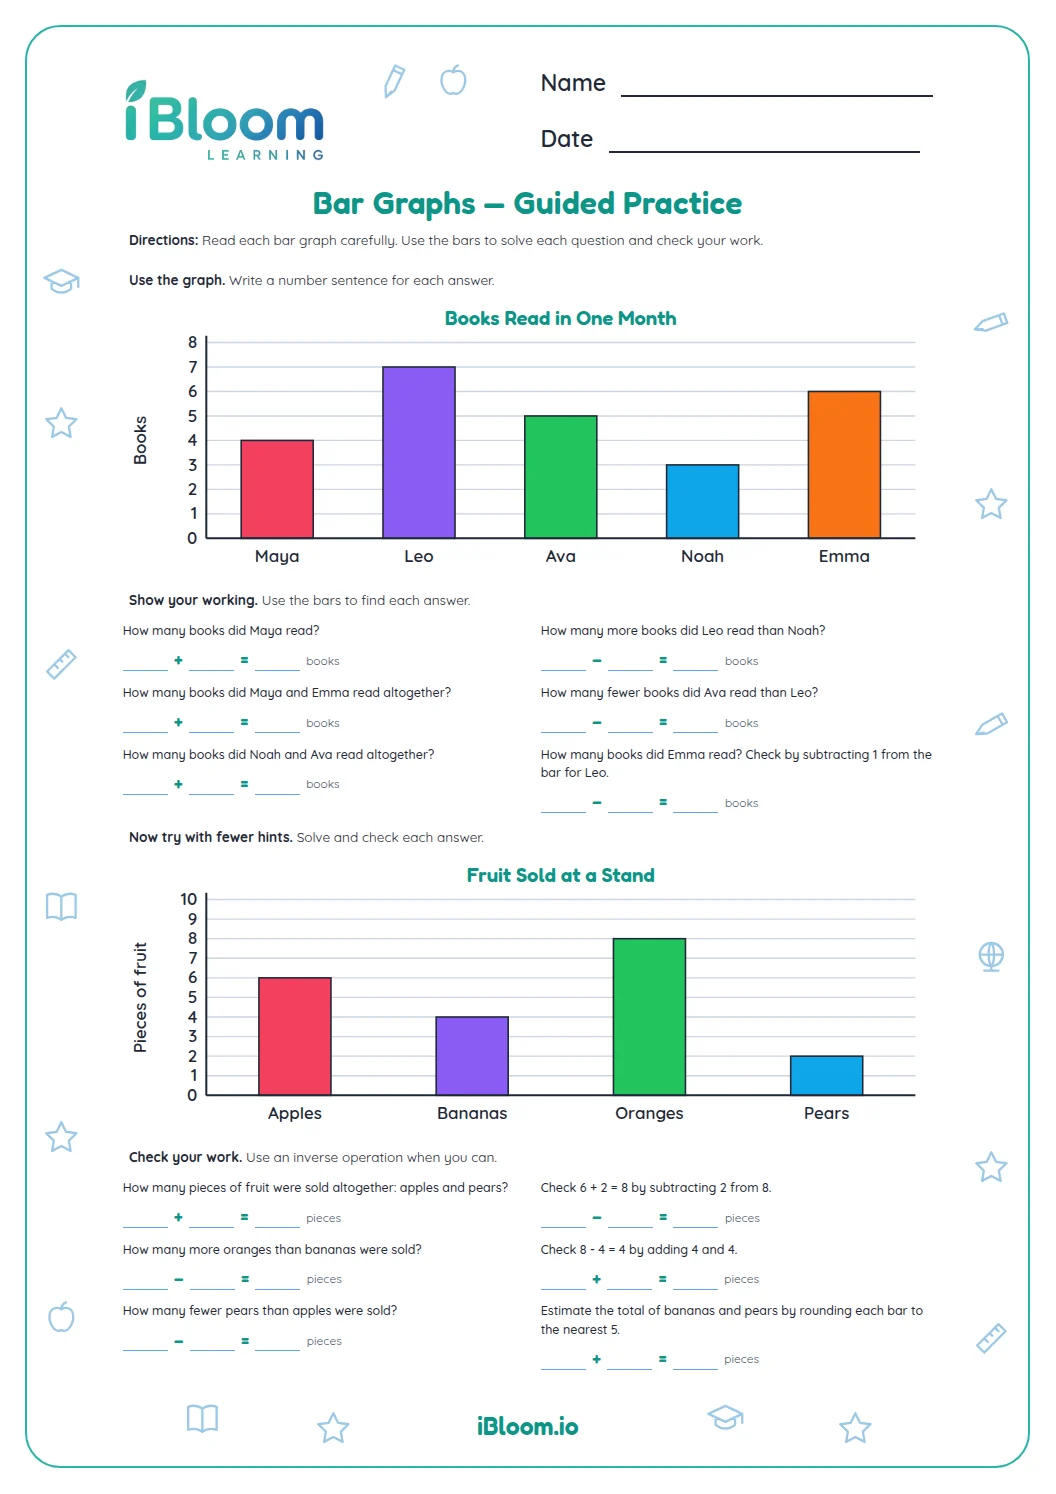
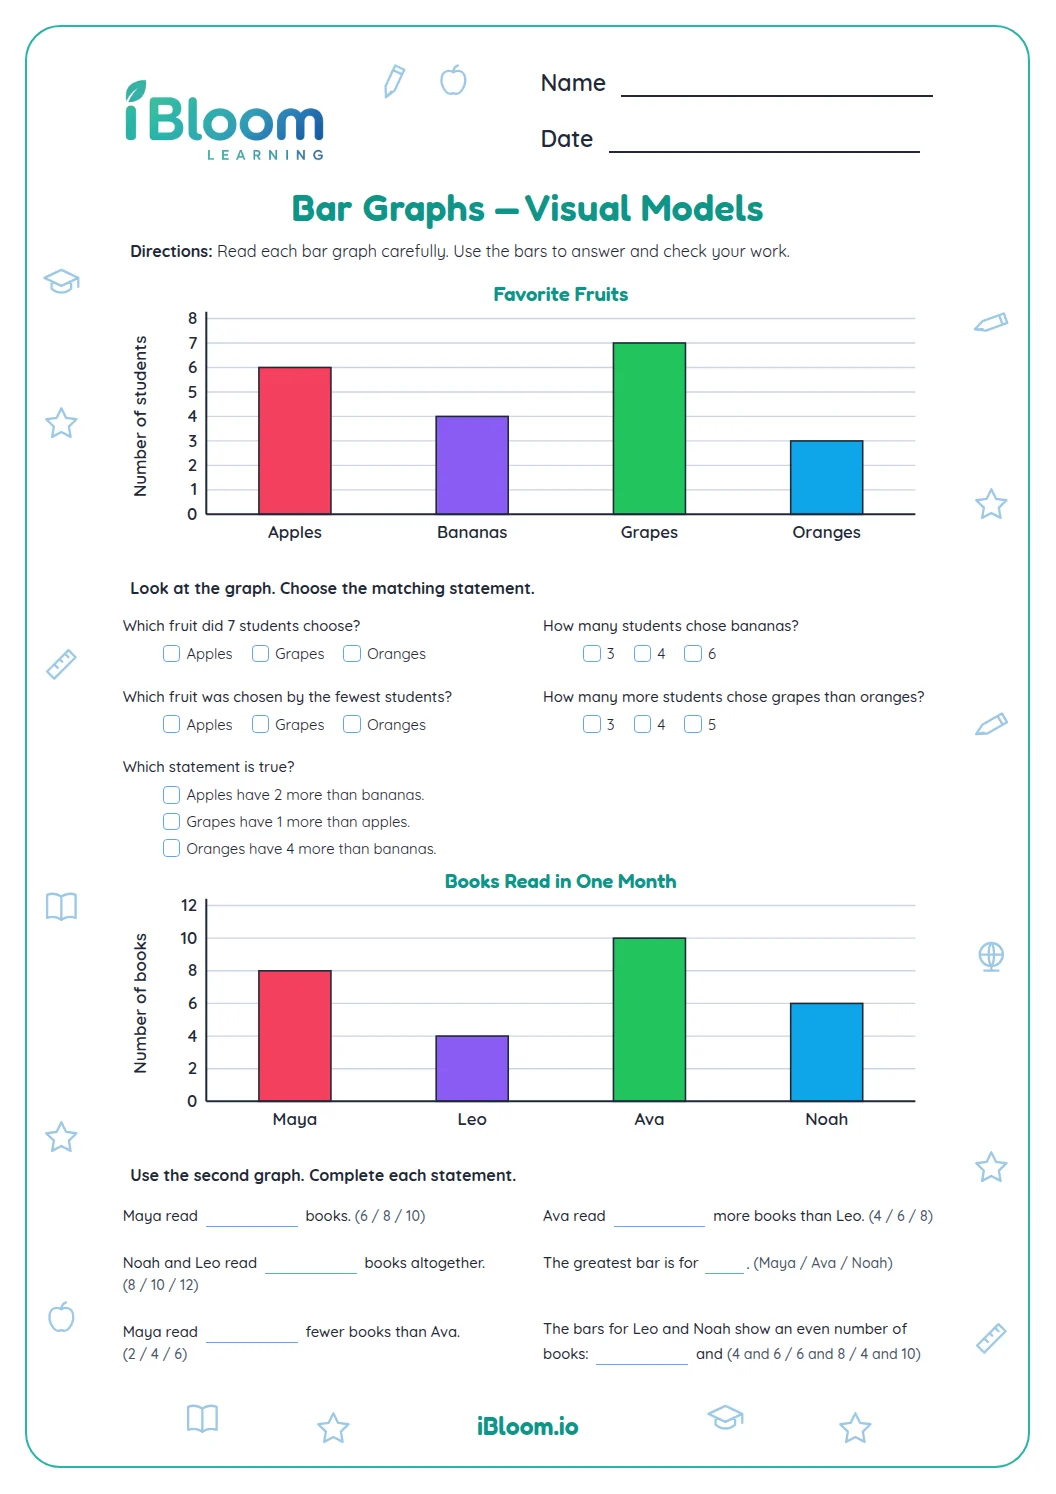
The bottom number tells how many equal parts make the whole, and the top number tells how many parts belong to the choice. In the worksheet’s bar models, count all equal sections first, then count the shaded sections. For example, one shaded section out of four is 1/4.
Why are the chart pictures drawn as bars?
The printable uses equal-part bars as a clear model for the slices in a pie chart. Each bar is divided into the same number of equal sections, and the colored sections show one category’s share. Children read the numerator and denominator from that model.
How do I read two of four equal parts?
Count two shaded parts and four parts altogether, then write 2/4. The answer names the selected share over the total. The worksheet includes several circles-to-bars style models with different totals so children practice reading both numbers. This is the basic numerator-over-denominator form.
Can two fractions show the same share?
Yes. For example, 2/4 and 1/2 both name one half. On this page, first read the total number of equal parts and the selected parts in the model; use that count to choose the fraction rather than guessing from how much color you see.
What should a learner do before checking the key?
For each model, count the equal parts in the whole bar, then count the shaded parts. Write the shaded count on top and the total count on the bottom. The separate key gives the expected fractions and choices for all 14 questions.