
About this worksheet
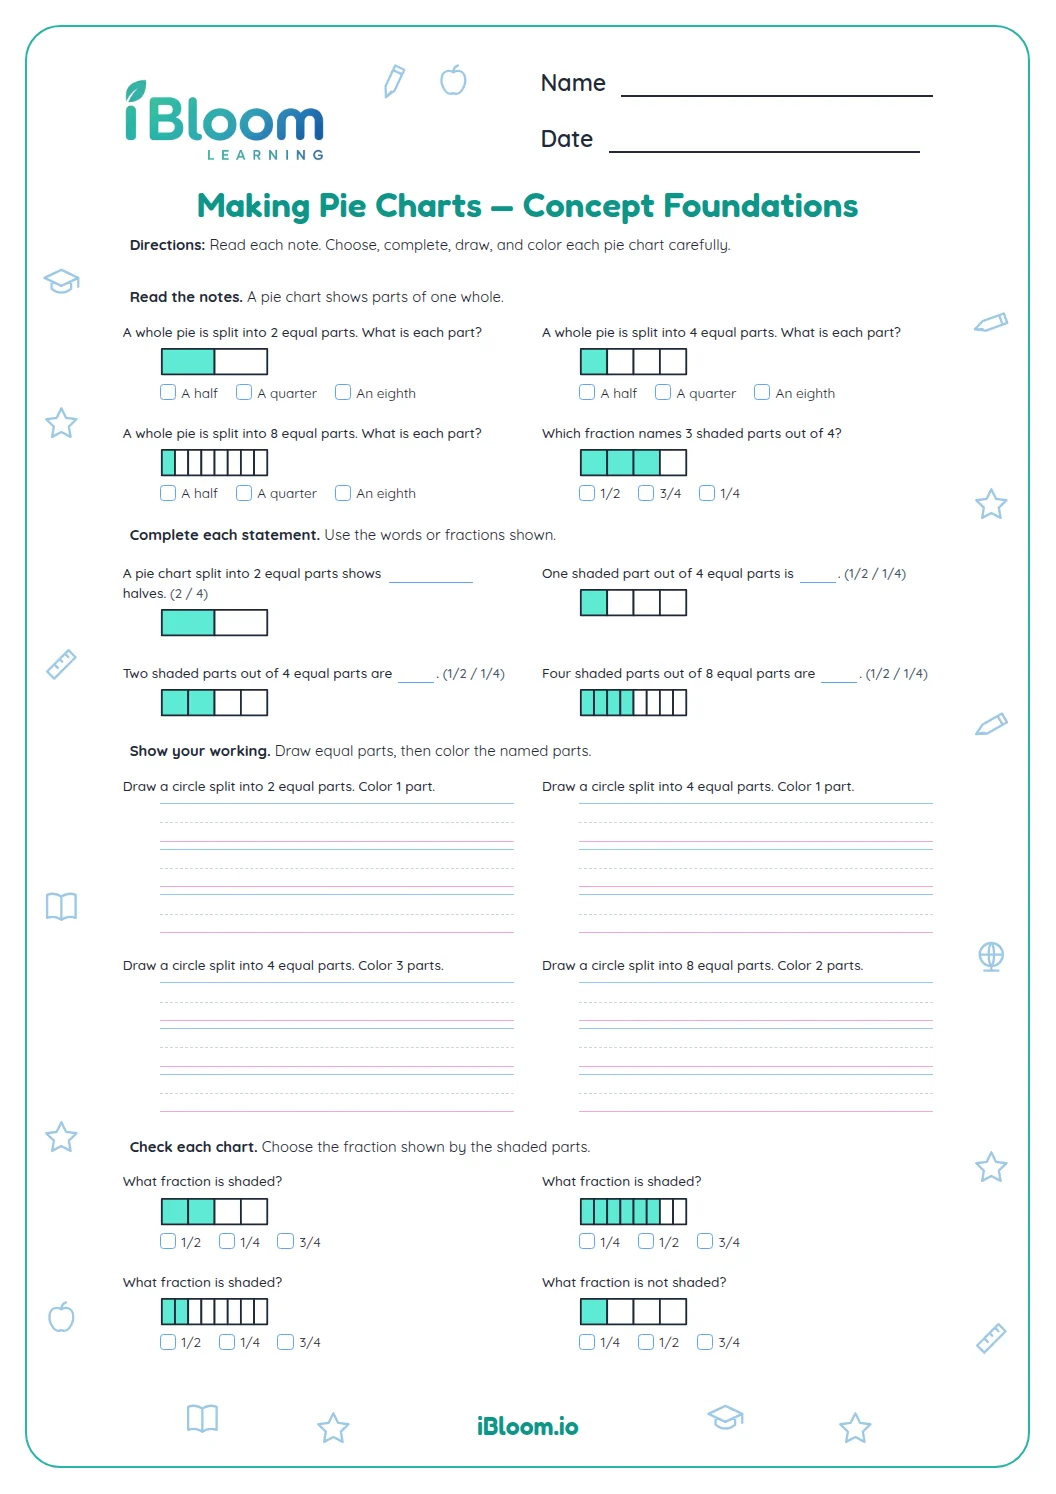
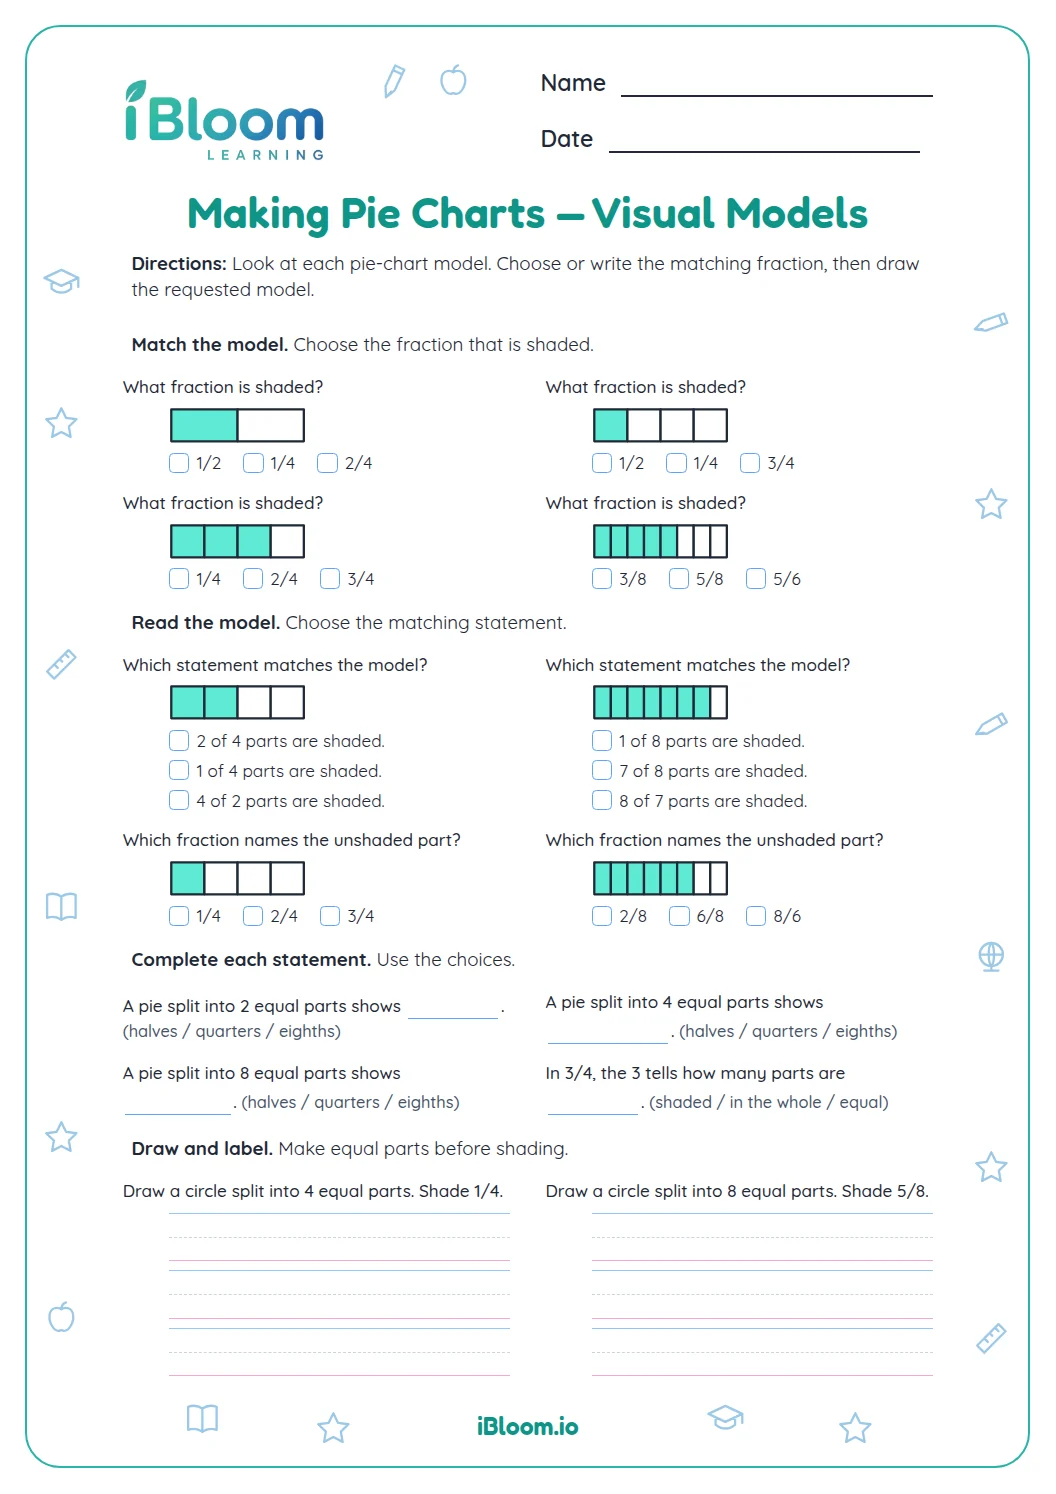
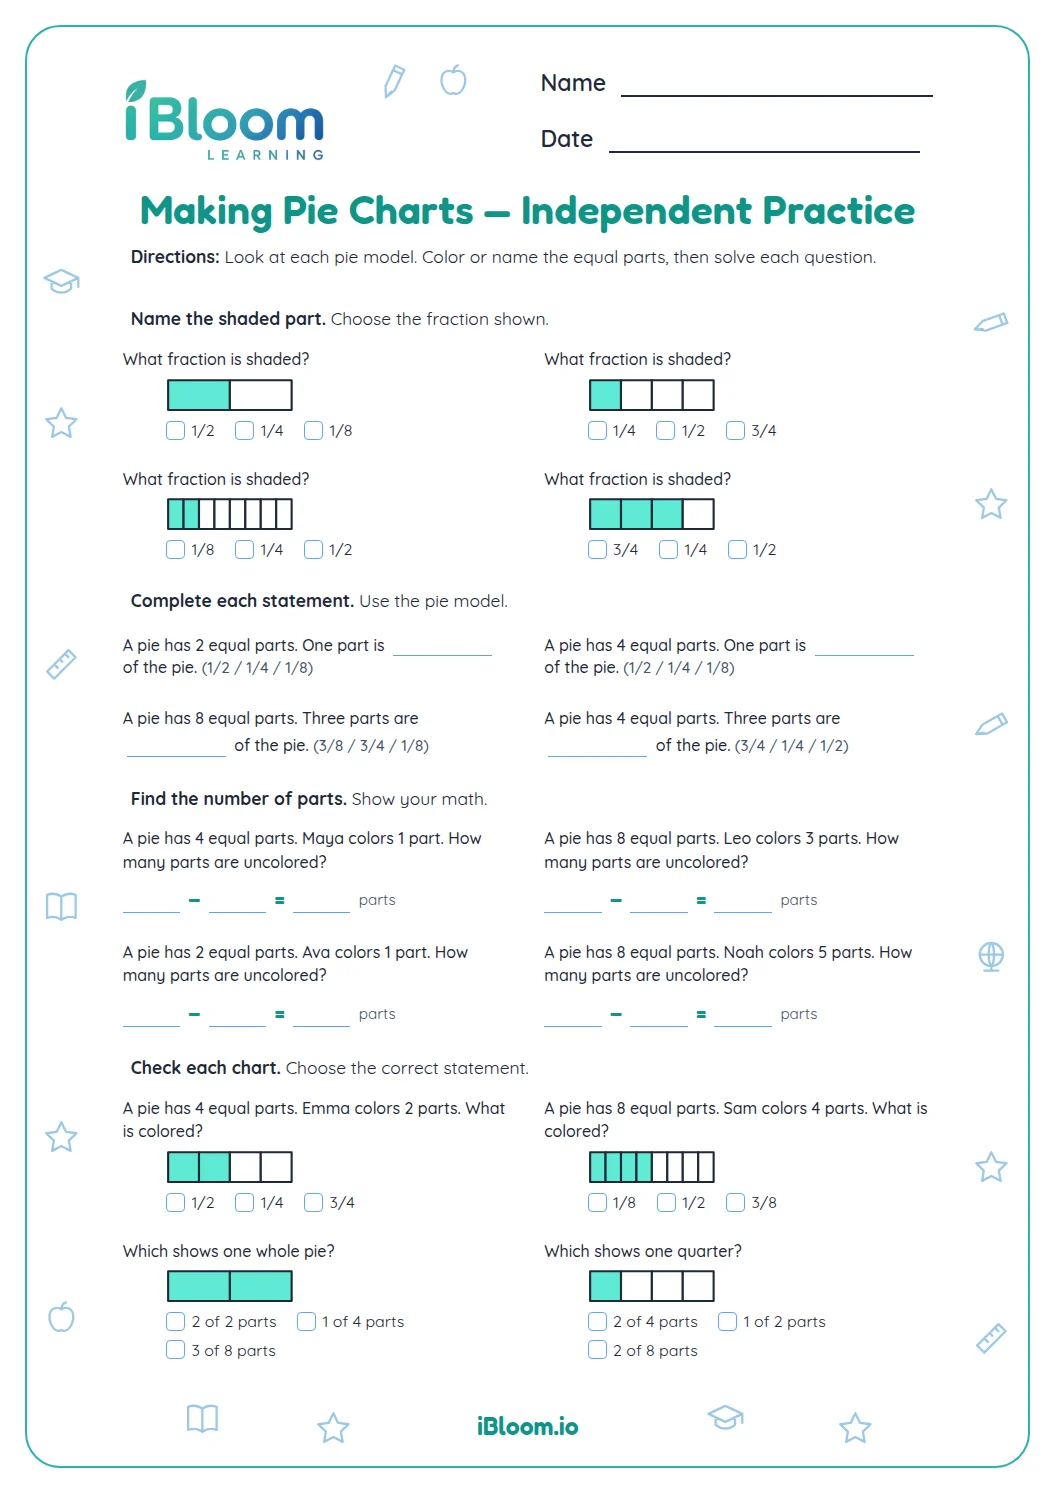
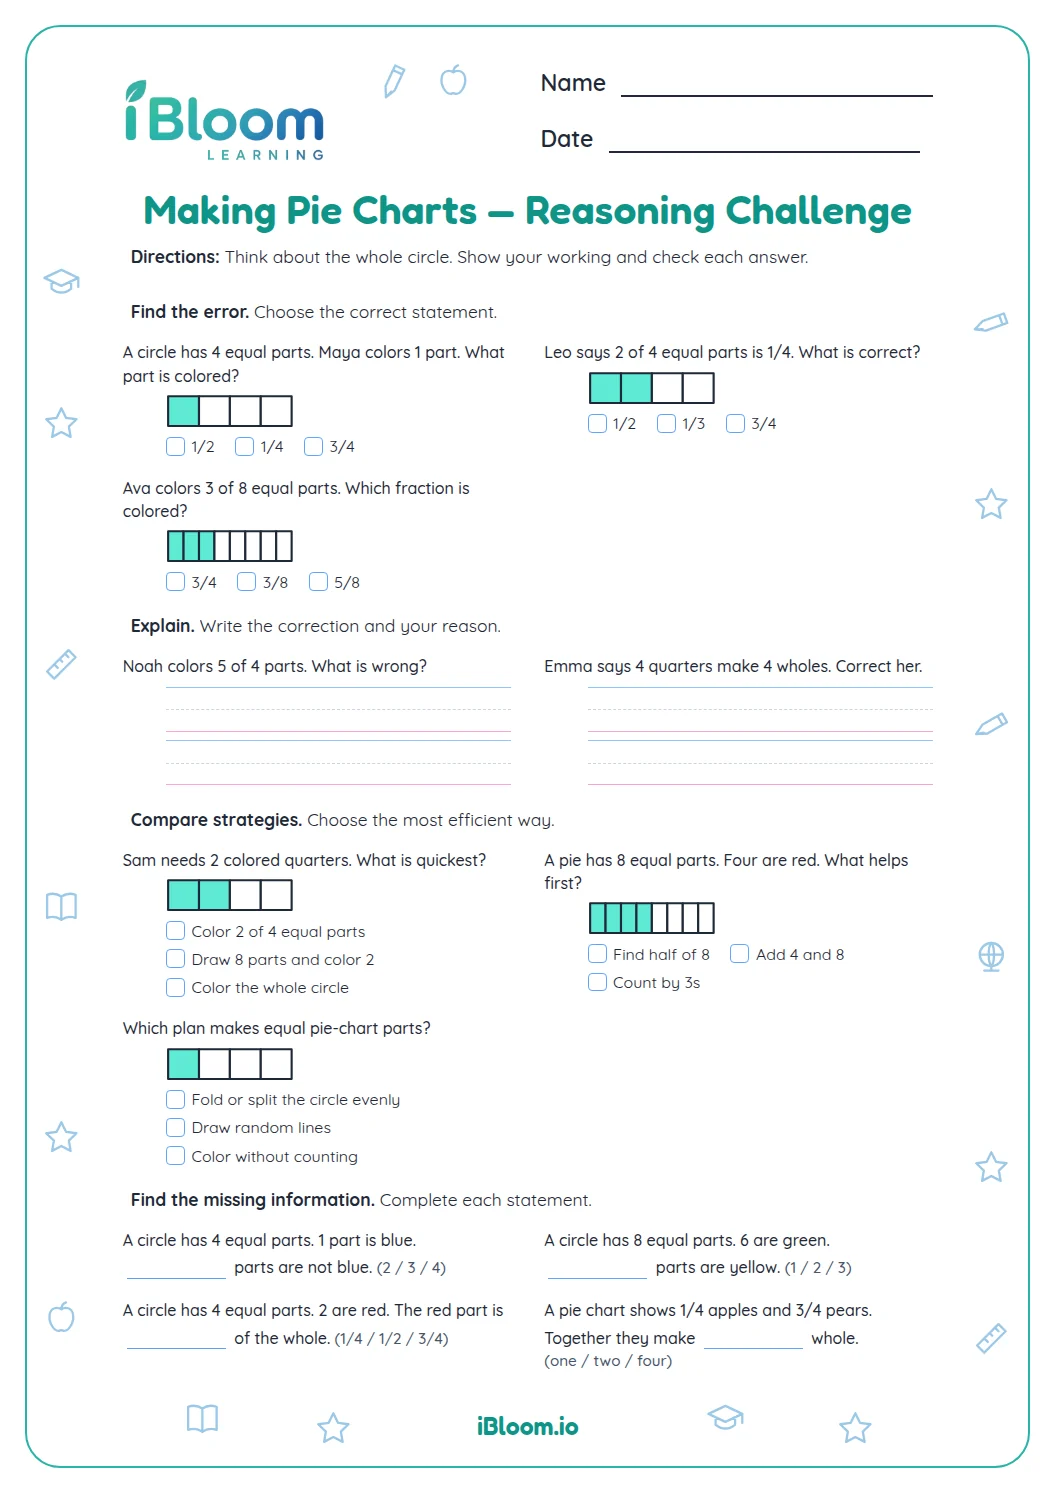
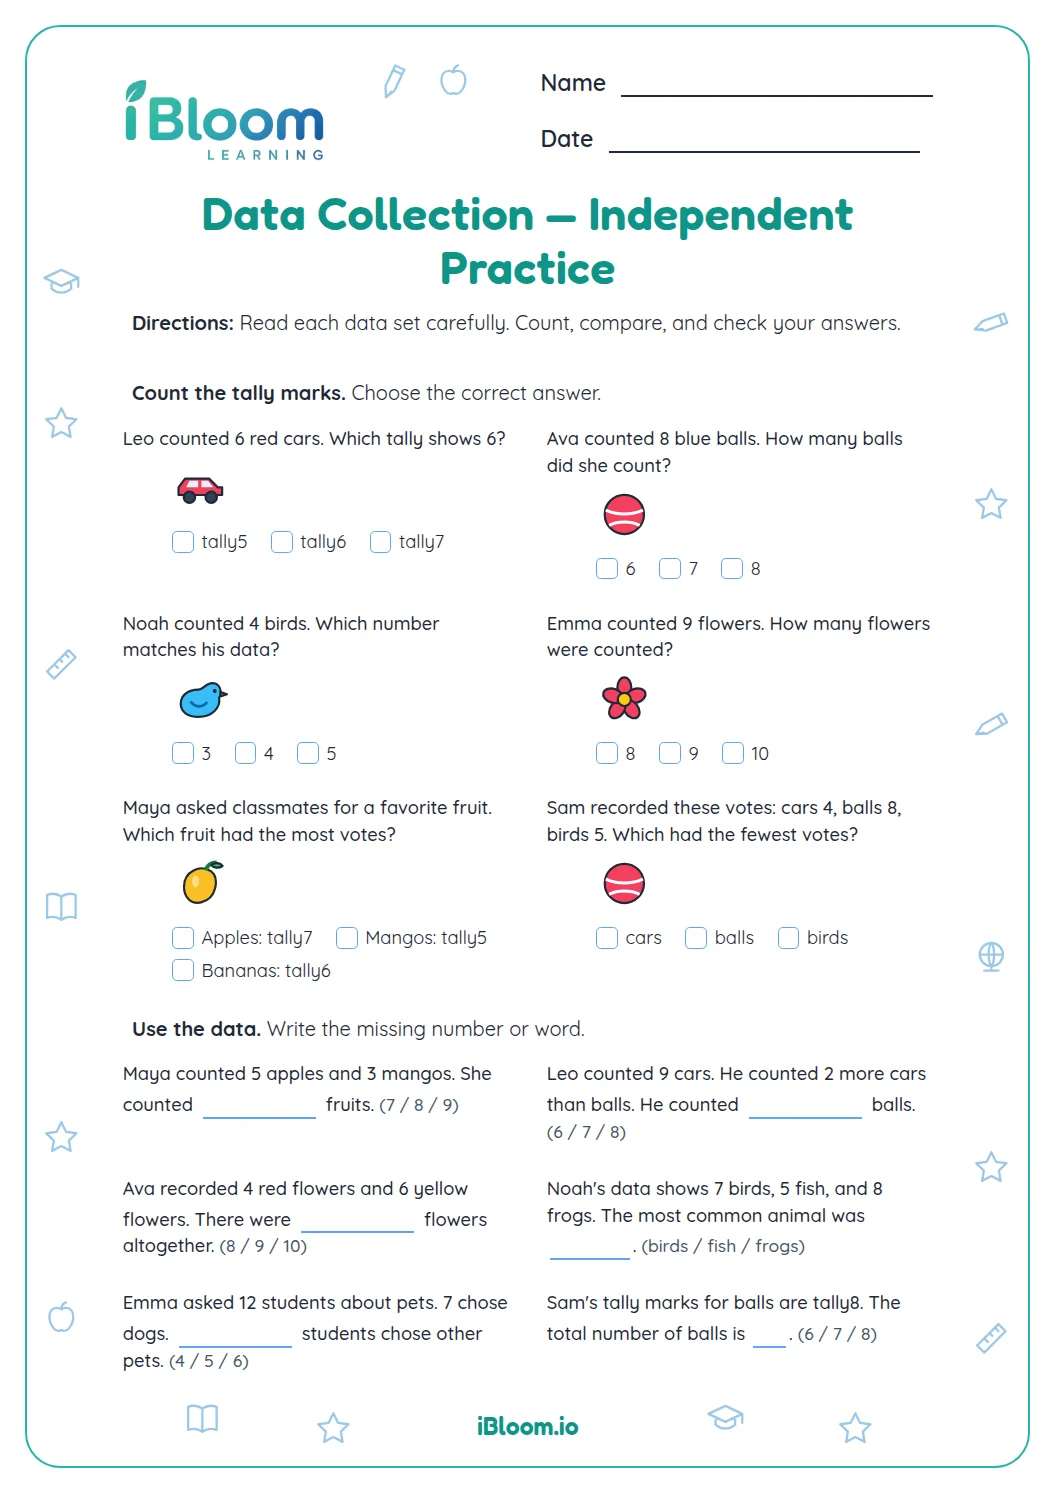
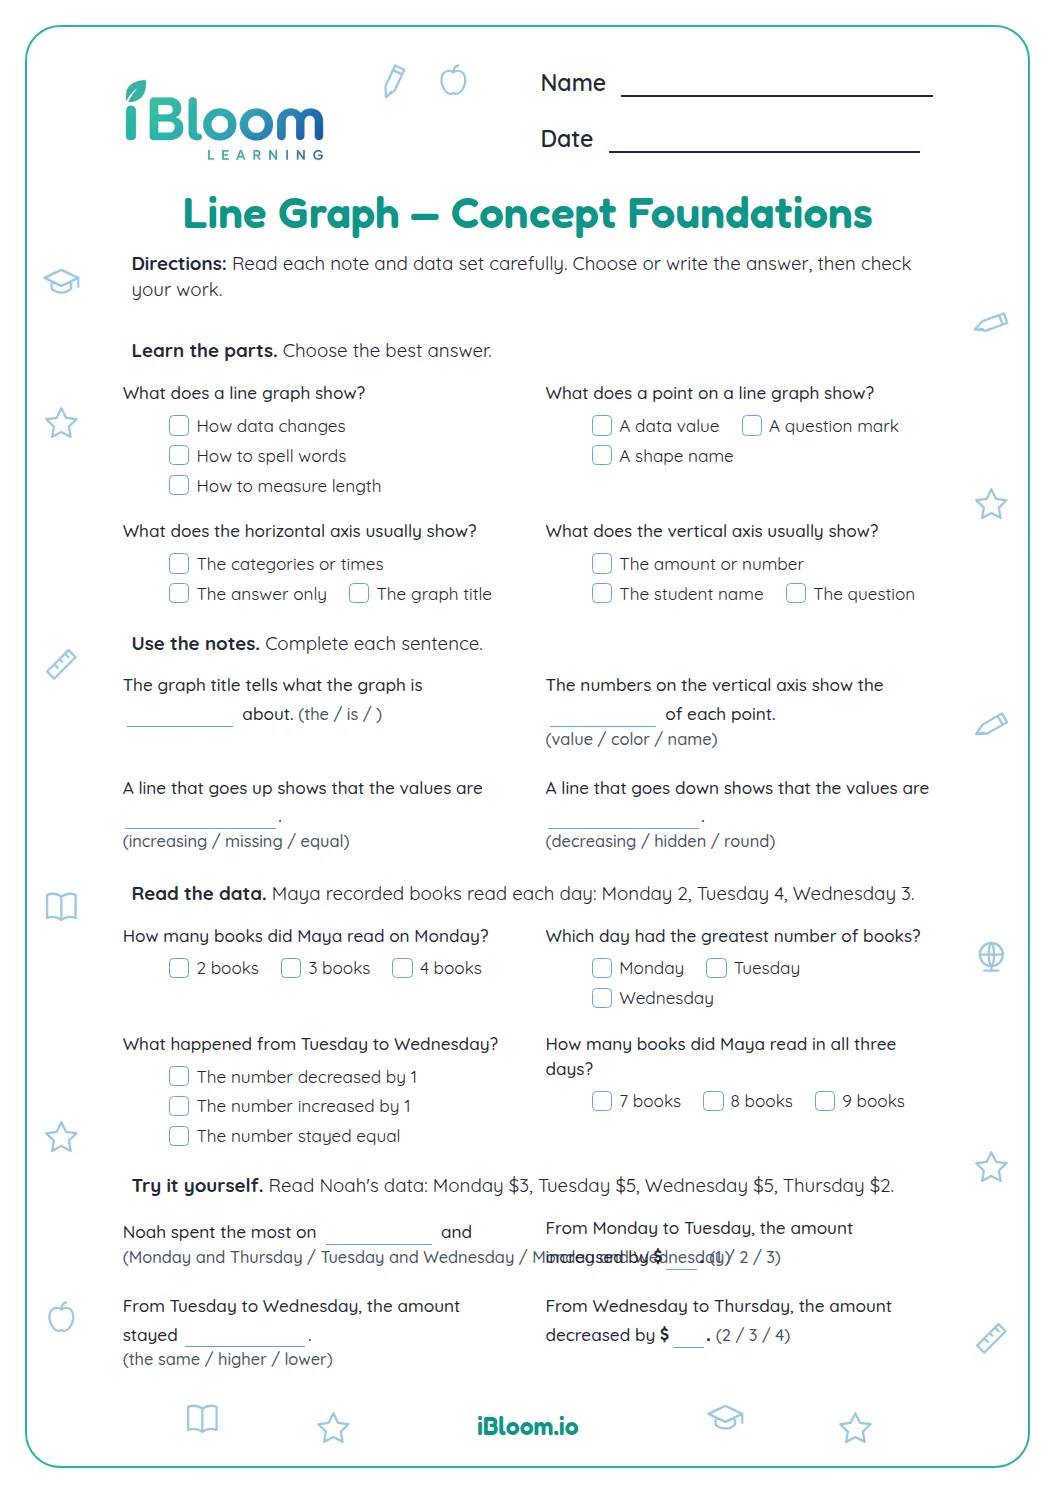
This Grade 2 printable builds foundations for pie-chart work through equal grouping and equal partitions. Students share category counts equally, name halves, thirds, and fourths, and read two shaded circle models. The template cannot provide a blank circle for students to draw a pie chart, so this replacement practices the equal-part reasoning behind chart construction. An answer key is included.
Aligned to 2.G.A.3
What does a pie chart represent?
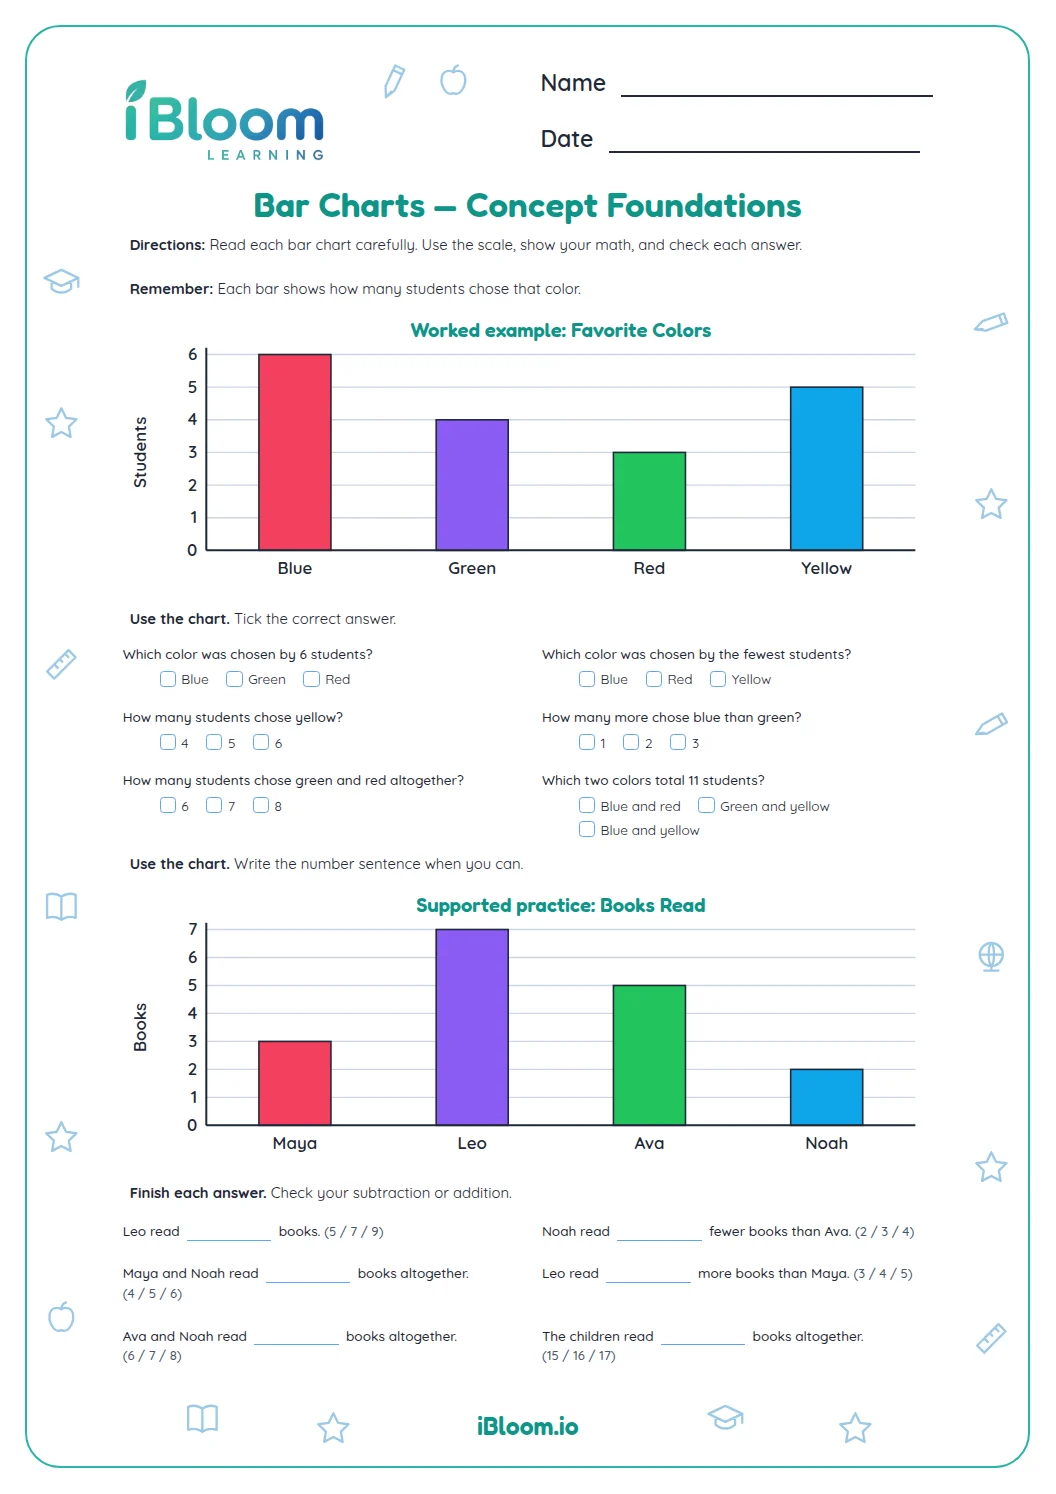
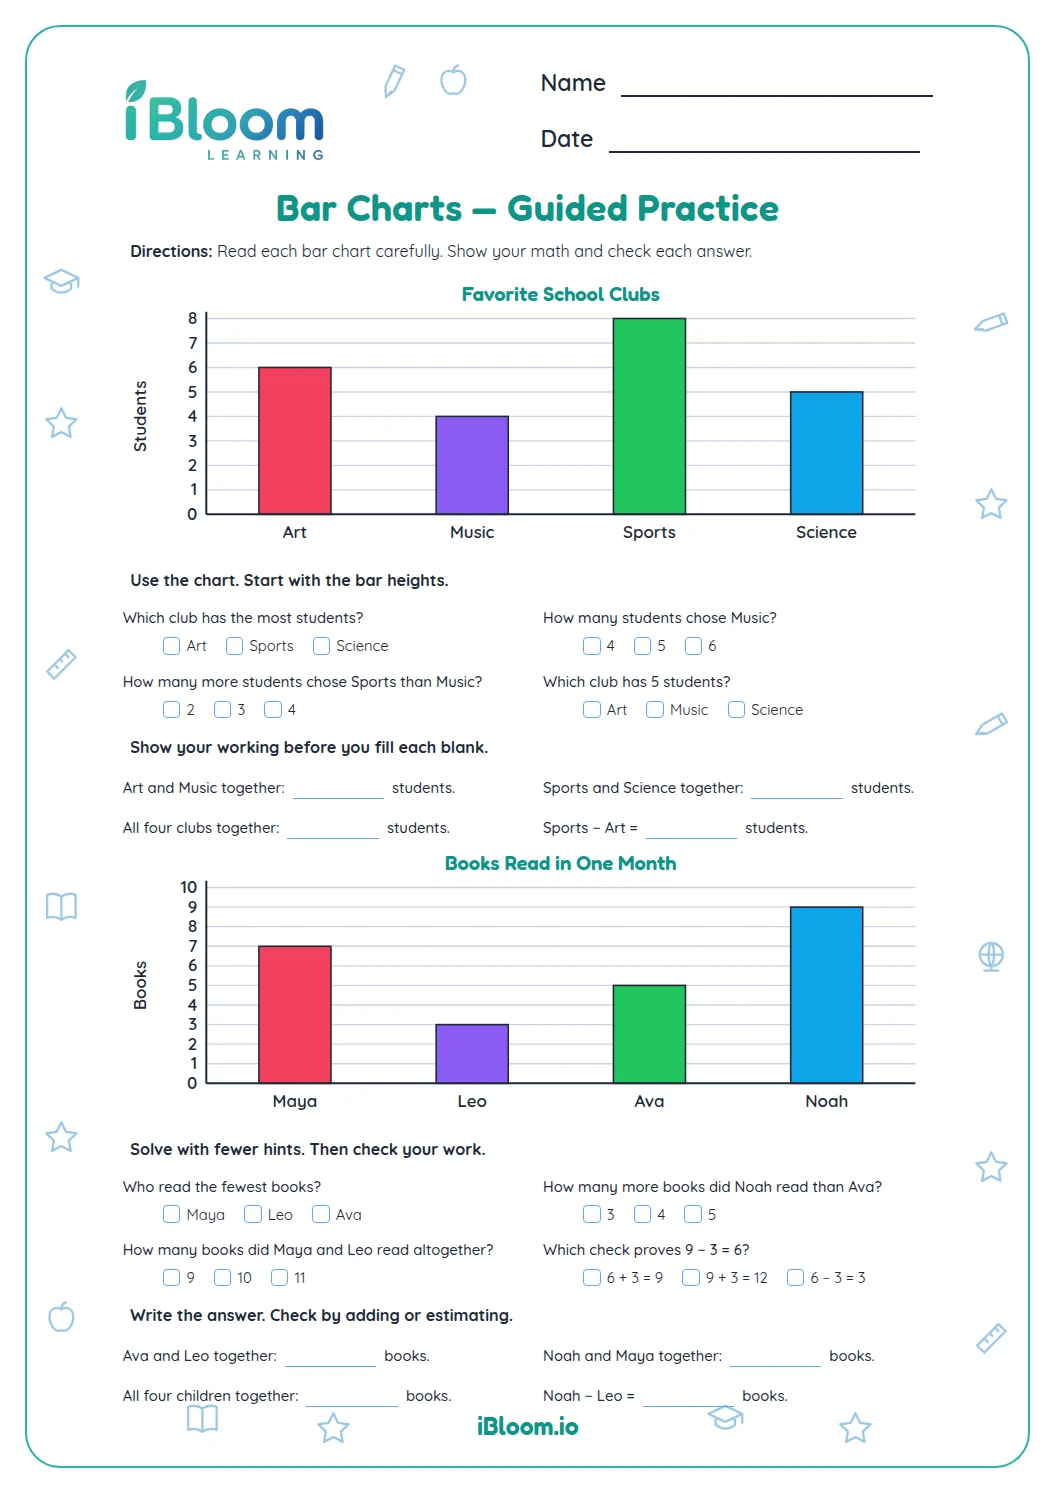
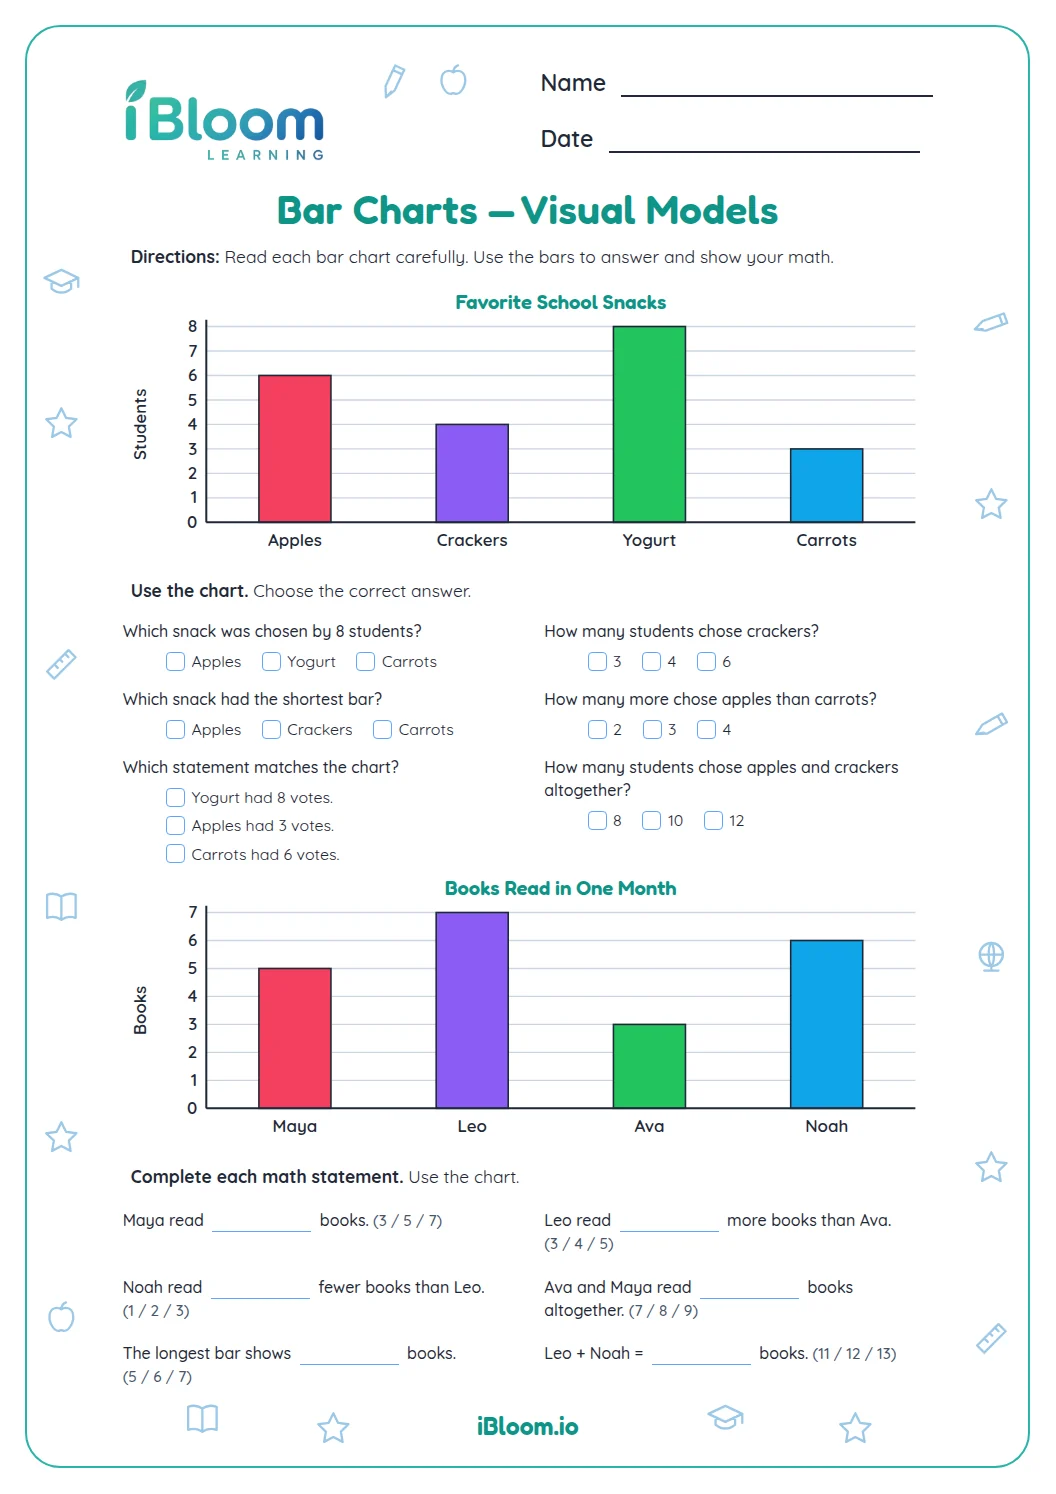
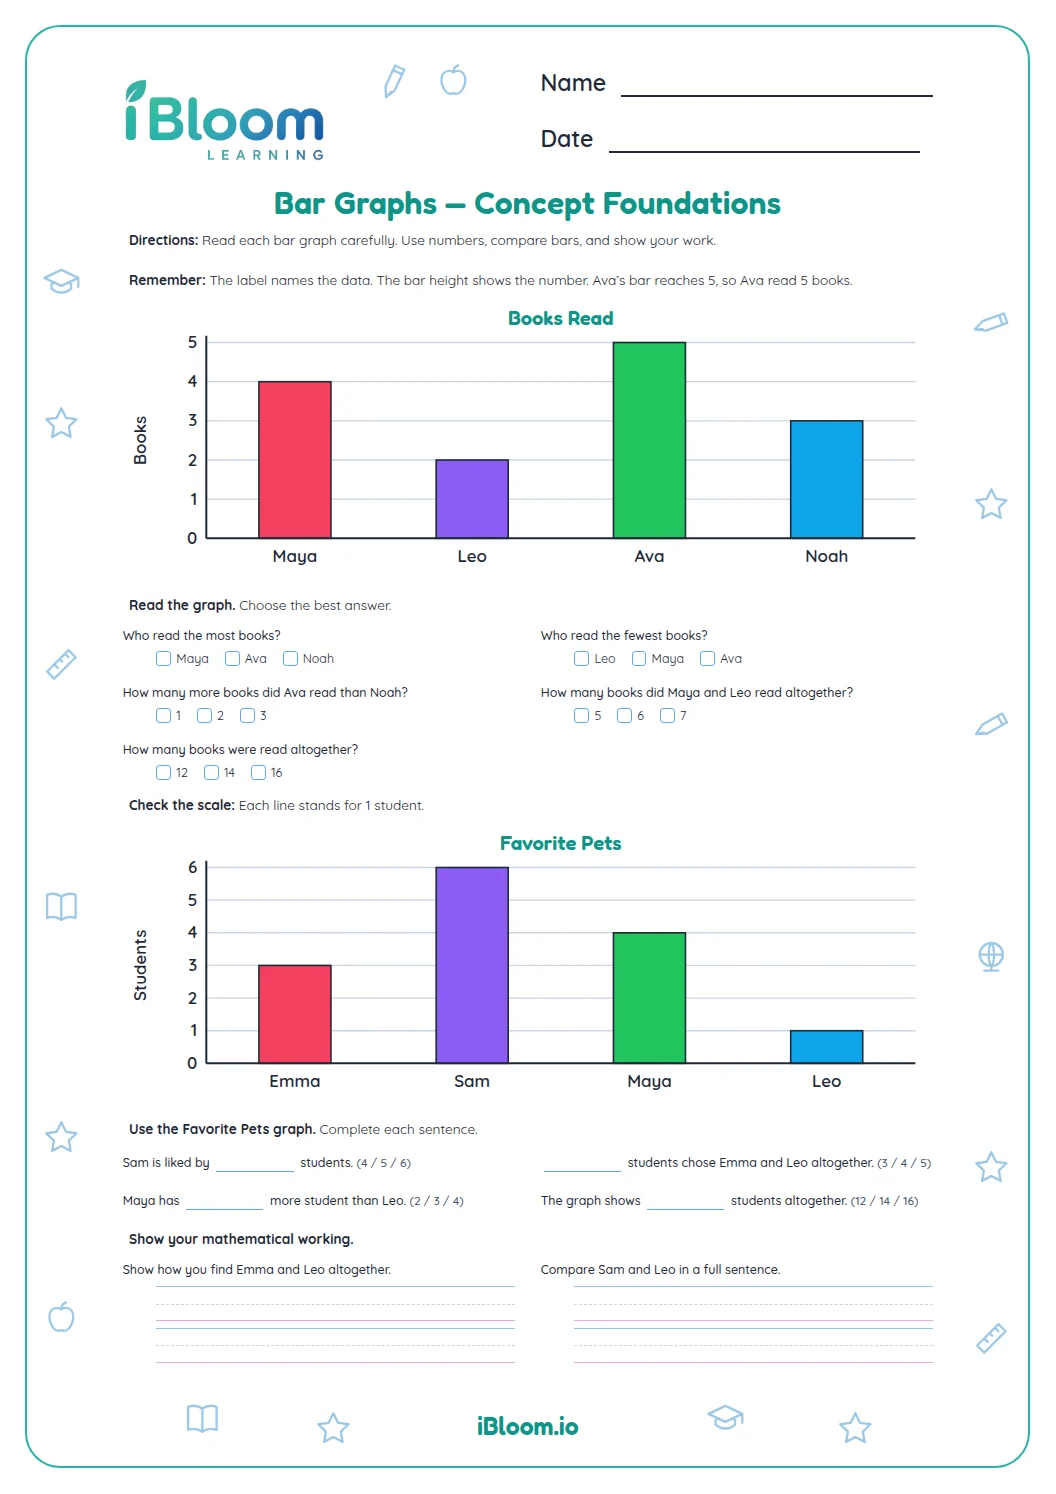
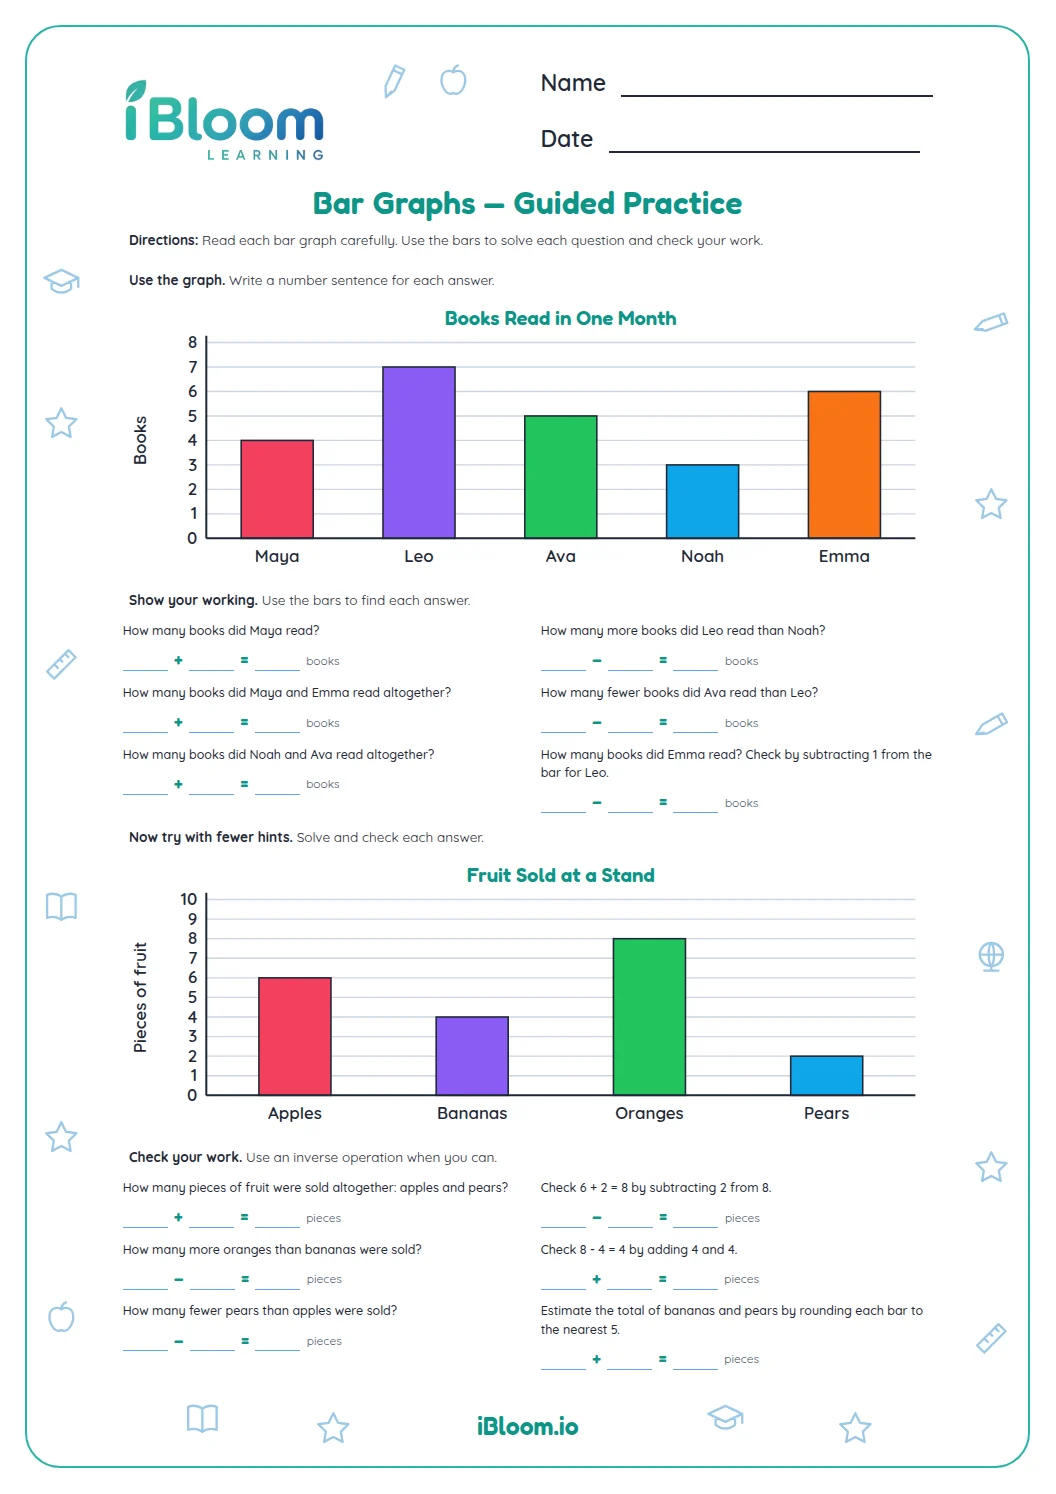
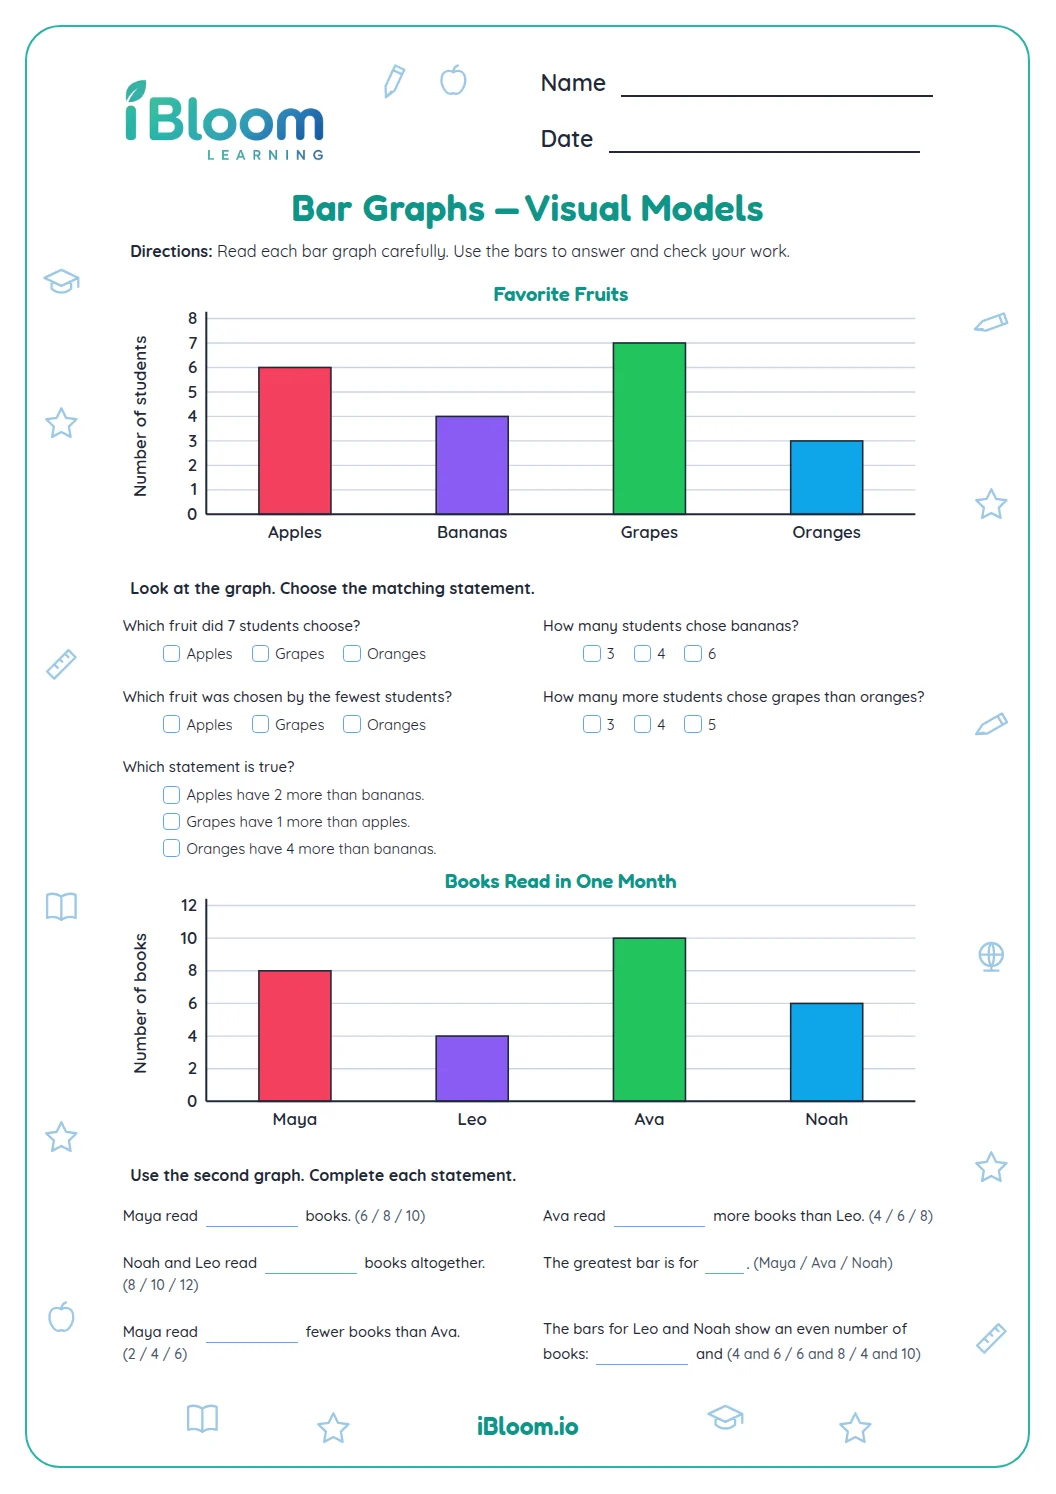
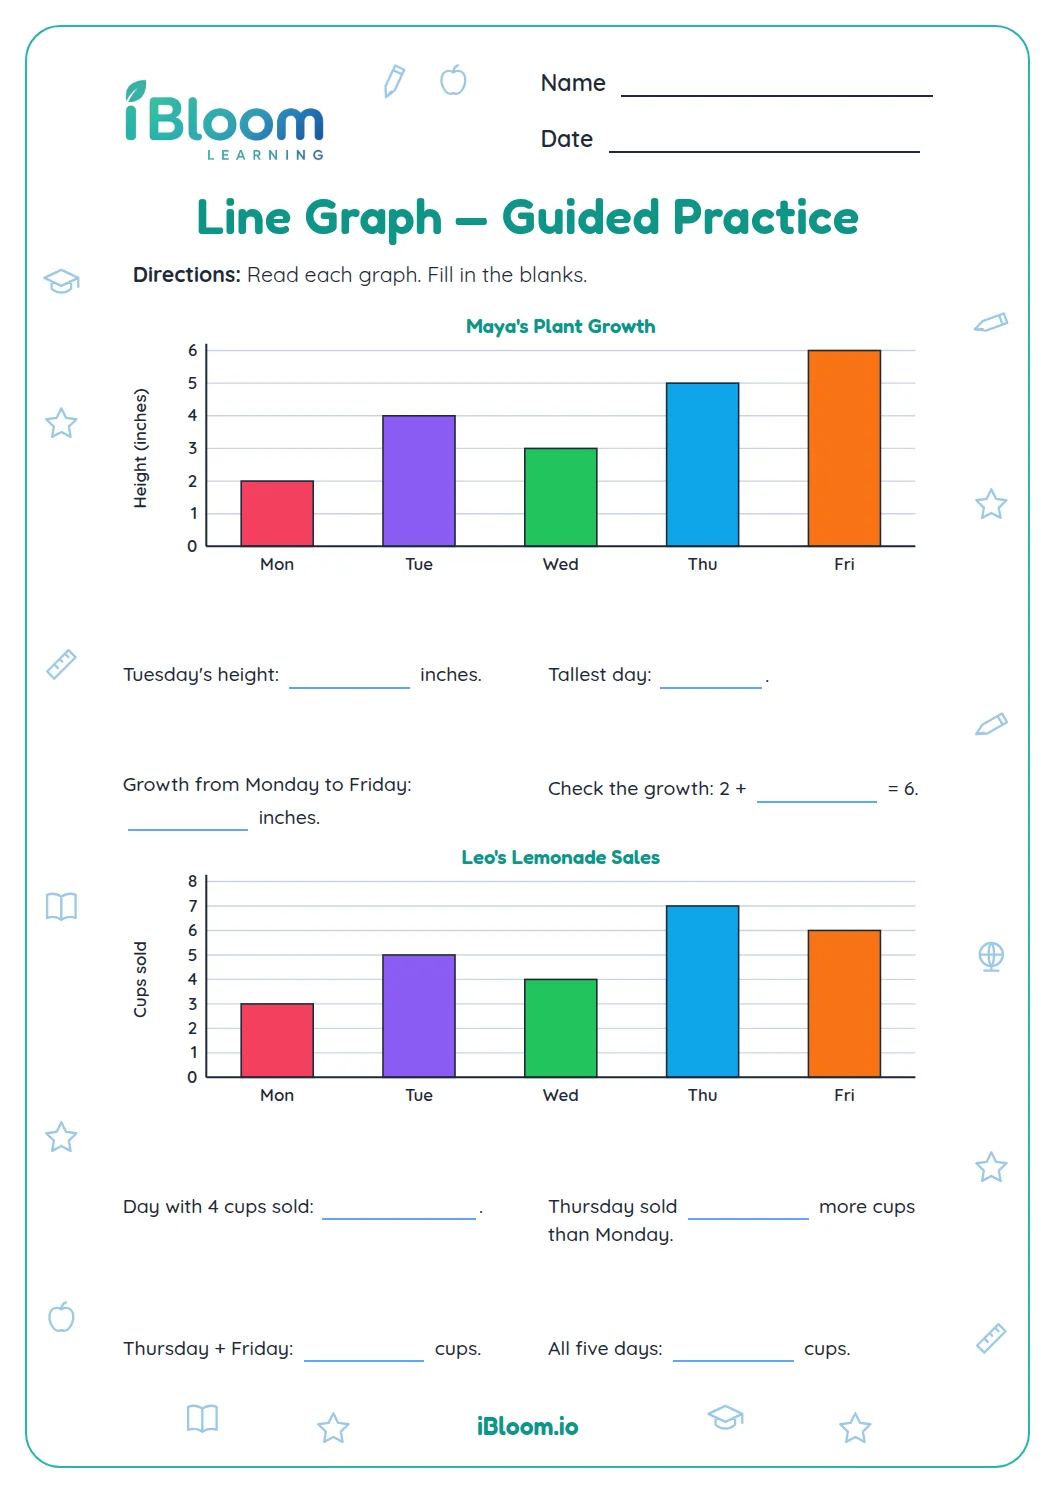
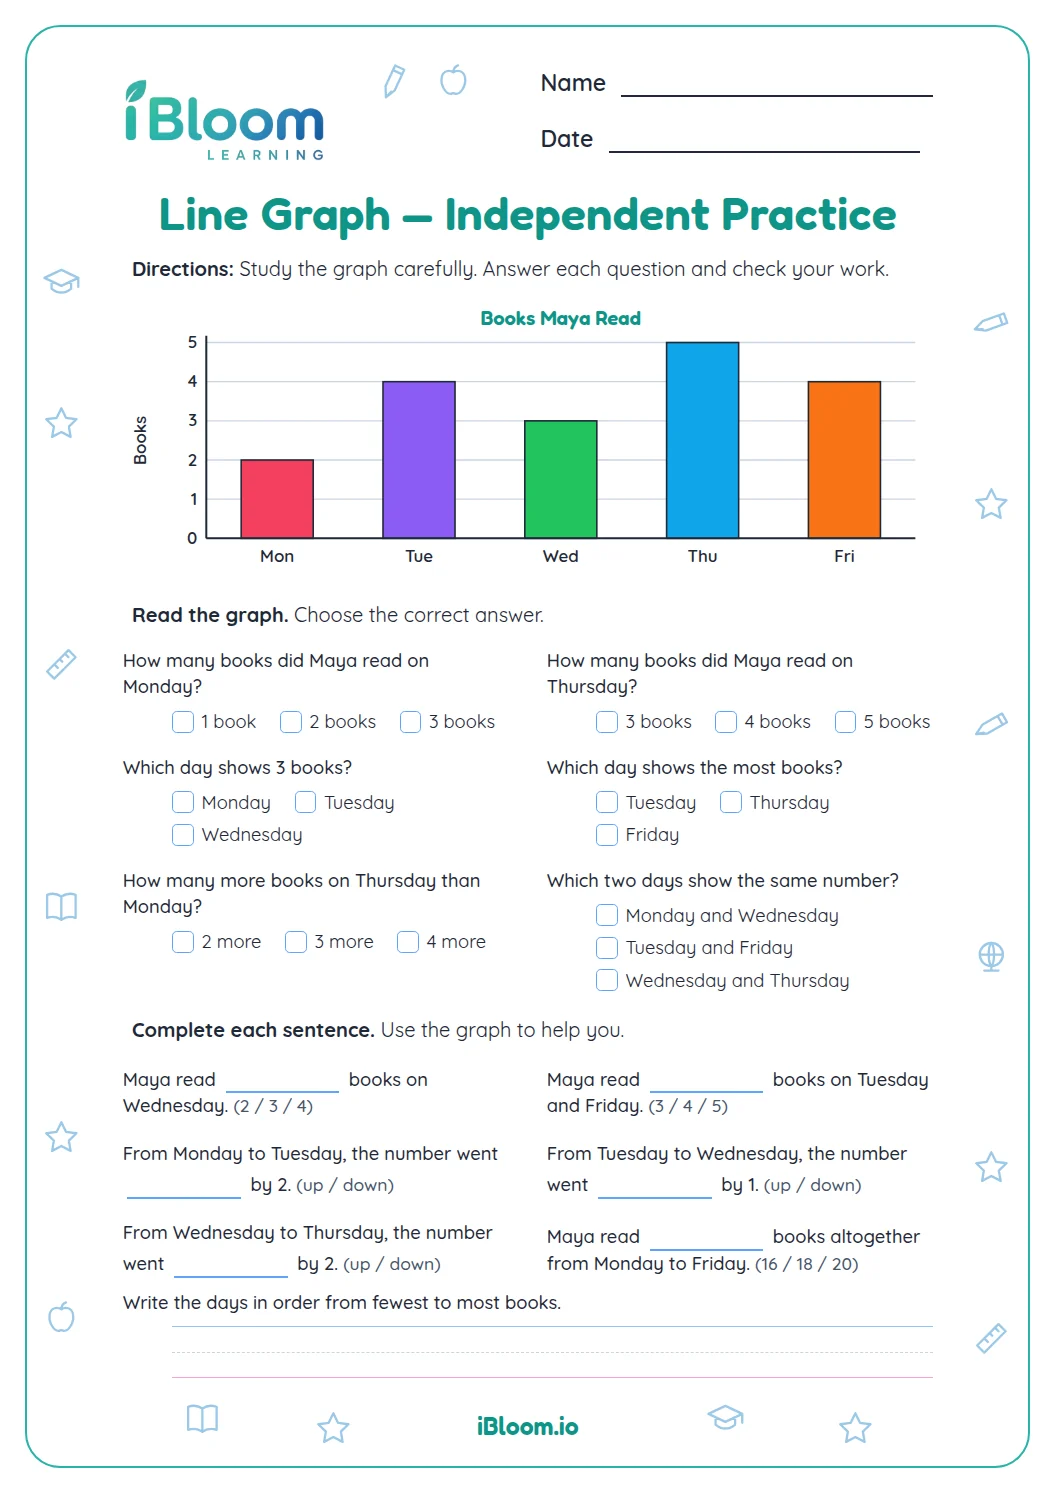
A pie chart shows categories as parts of one whole. To read one, a learner needs to compare category counts and understand equal parts. This practice uses a bar graph, a table, and shaded circle models to work on those ideas.
How can you compare a category with the whole?
Read a category’s value, then consider the total across categories. For the Favorite Fruit graph, Apple has 4 votes; the four categories together have 16. Four of 16 votes belong to Apple.
- 1In Favorite Fruit, how many votes did Apple get?
- 2Find Apple on the graph and follow its bar.
- 3Answer: 4 votes
What do the models help children practice?
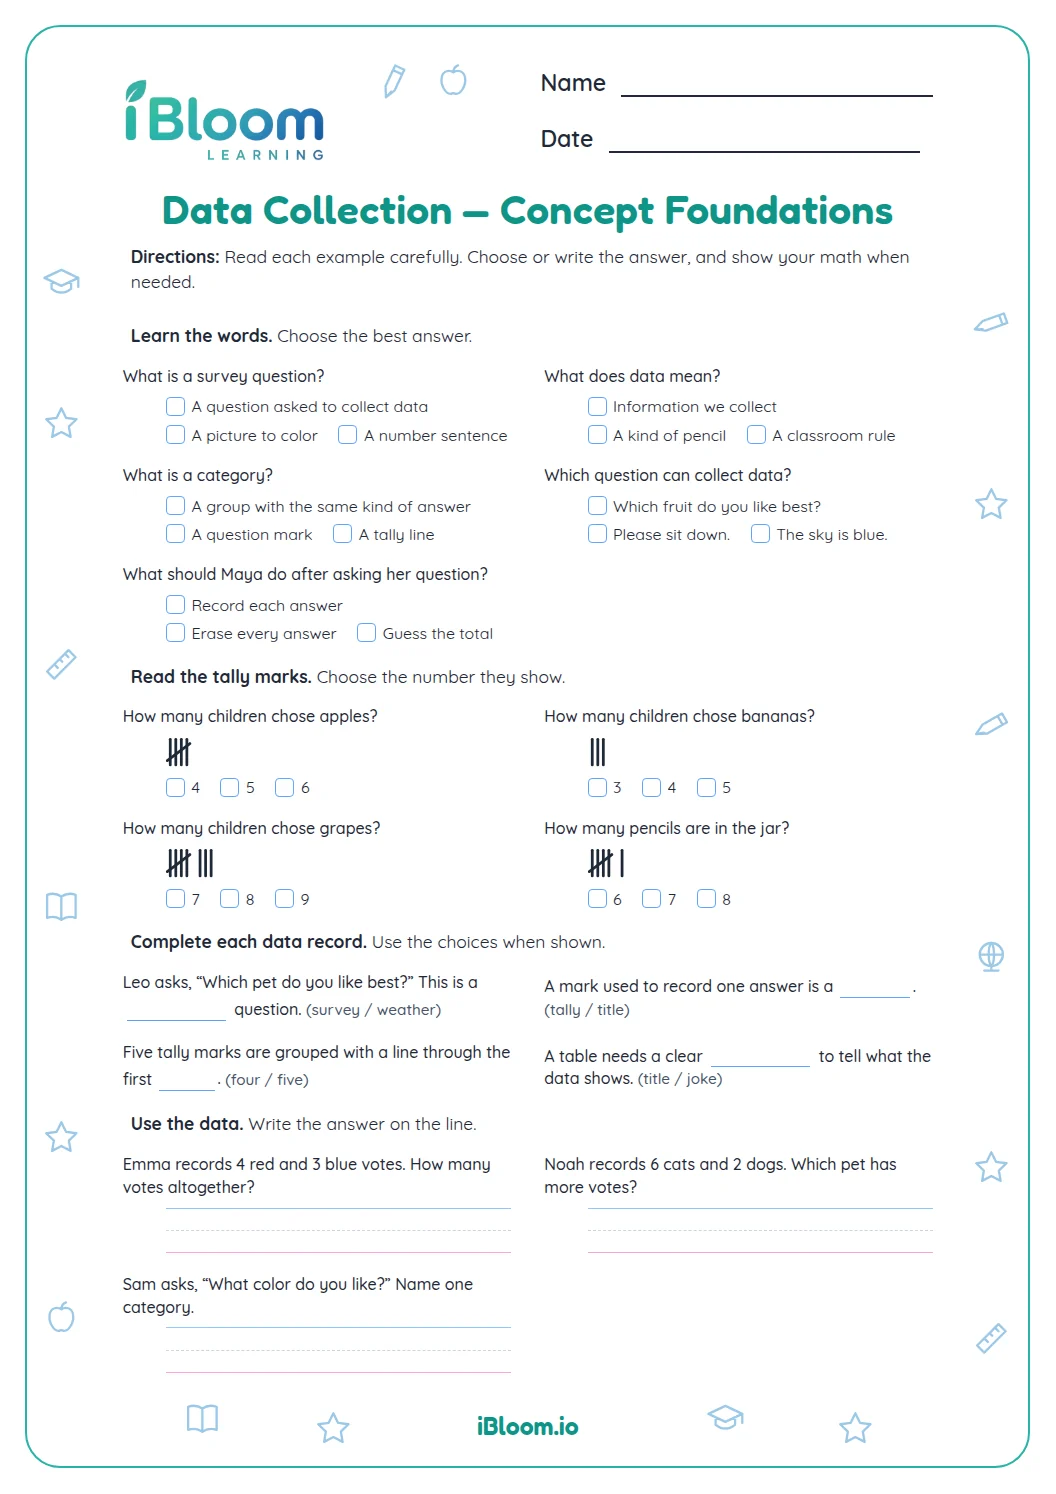
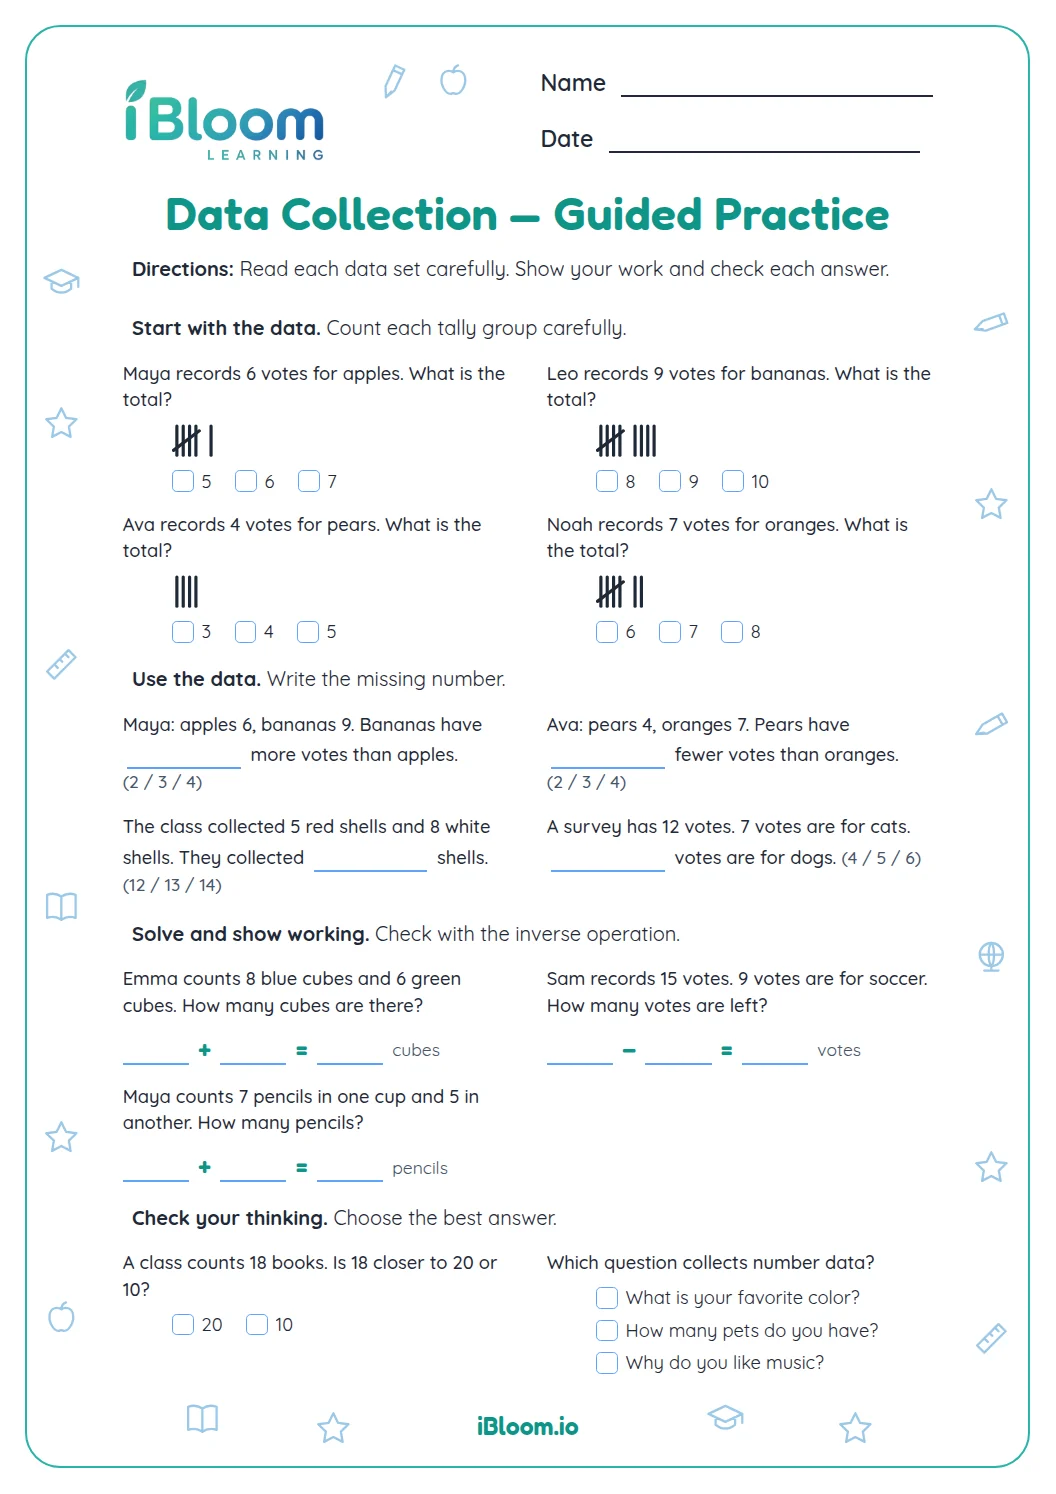
The worksheet has 16 questions: three read graph or table data, while others connect equal sharing with halves and fourths. Shaded fraction models show the parts directly. The answer key gives a response for each item.
How to use this worksheet
- 1Read the graph labels and number scale.
- 2Use the table to compare the category counts.
- 3Add category counts when asked for the total.
- 4Look at how many equal parts make the whole.
- 5Use the key to check each response.
Common mistakes and quick fixes
The mistake
Calling the largest category the total.
The fix
Add all category counts to find the whole.
The mistake
Confusing a half with a fourth.
The fix
Check how many equal parts make one whole.
The mistake
Reading a graph bar from the wrong scale mark.
The fix
Follow the bar to the labeled value axis.
This worksheet practices naming equal shares and describing the whole.
Partition circles and rectangles into equal halves, thirds, and fourths.
On this sheet: Students name equal shares and connect equal groups with halves, thirds, and fourths.
Show the official wordingHide the official wording
Partition circles and rectangles into two, three, or four equal shares. Describe the shares using the words halves, thirds, half of, a third of, etc., and describe the whole as two halves, three thirds, four fourths. Recognize that equal shares of identical wholes need not have the same shape.
What to practice next
Make more practice
Questions parents and teachers ask
What does this worksheet teach about pie charts?
It practices two ideas used to make sense of pie charts: sharing counts equally among categories and naming equal parts of a whole. Students answer 14 compact questions, including two shaded circle models, and can check each response in the answer key.
Can students draw a pie chart on this page?
The page uses equal-group questions and shaded circle models to practice the reasoning behind a pie chart. Students divide counts into equal groups and name halves, thirds, and fourths. The template provides shaded examples rather than a blank chart for drawing.
Which equal parts appear?
The questions use halves, thirds, and fourths. Students identify the name of one equal part, count how many parts make a whole, and recognize fractions such as two fourths and three fourths. The answer key gives a short response for each item.
How do equal groups connect to a pie chart?
Each category in a pie chart represents a share of a whole. When category counts are equal, the shares are equal too. The worksheet includes equal-sharing questions so students can connect vote totals with the number of categories.
Is an answer key included?
Yes. A separate answer key lists all 14 answers. For fraction questions, check the number of selected parts and the total equal parts before comparing the written response with the key. For sharing questions, divide the count equally among the choices.