
About this worksheet
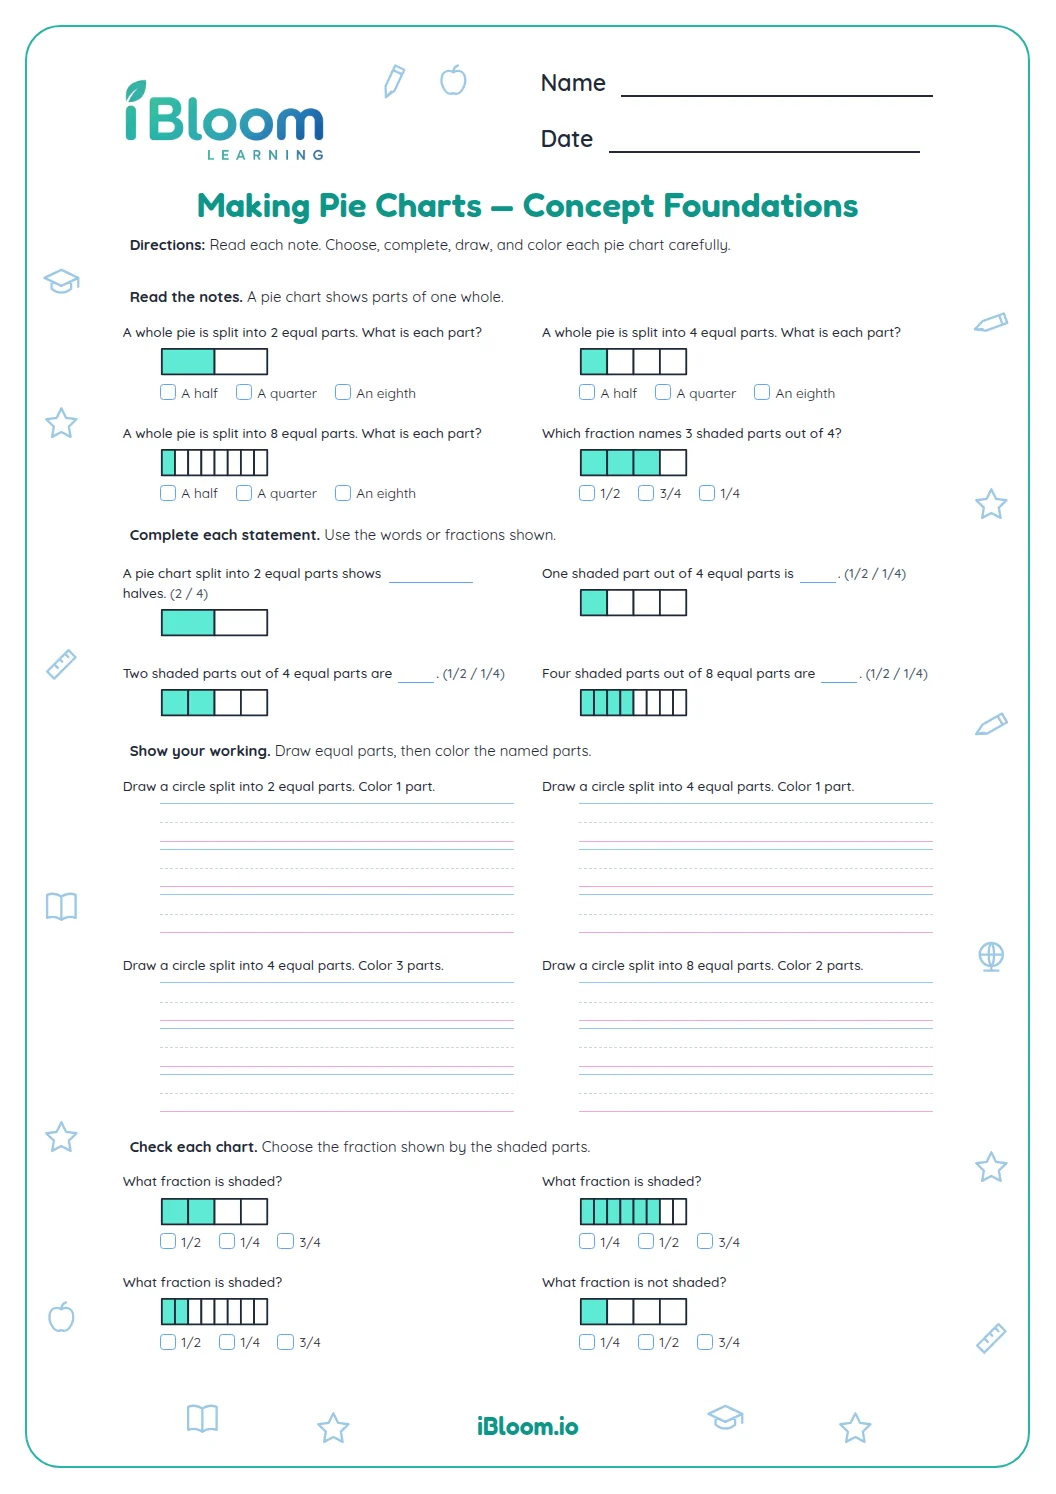
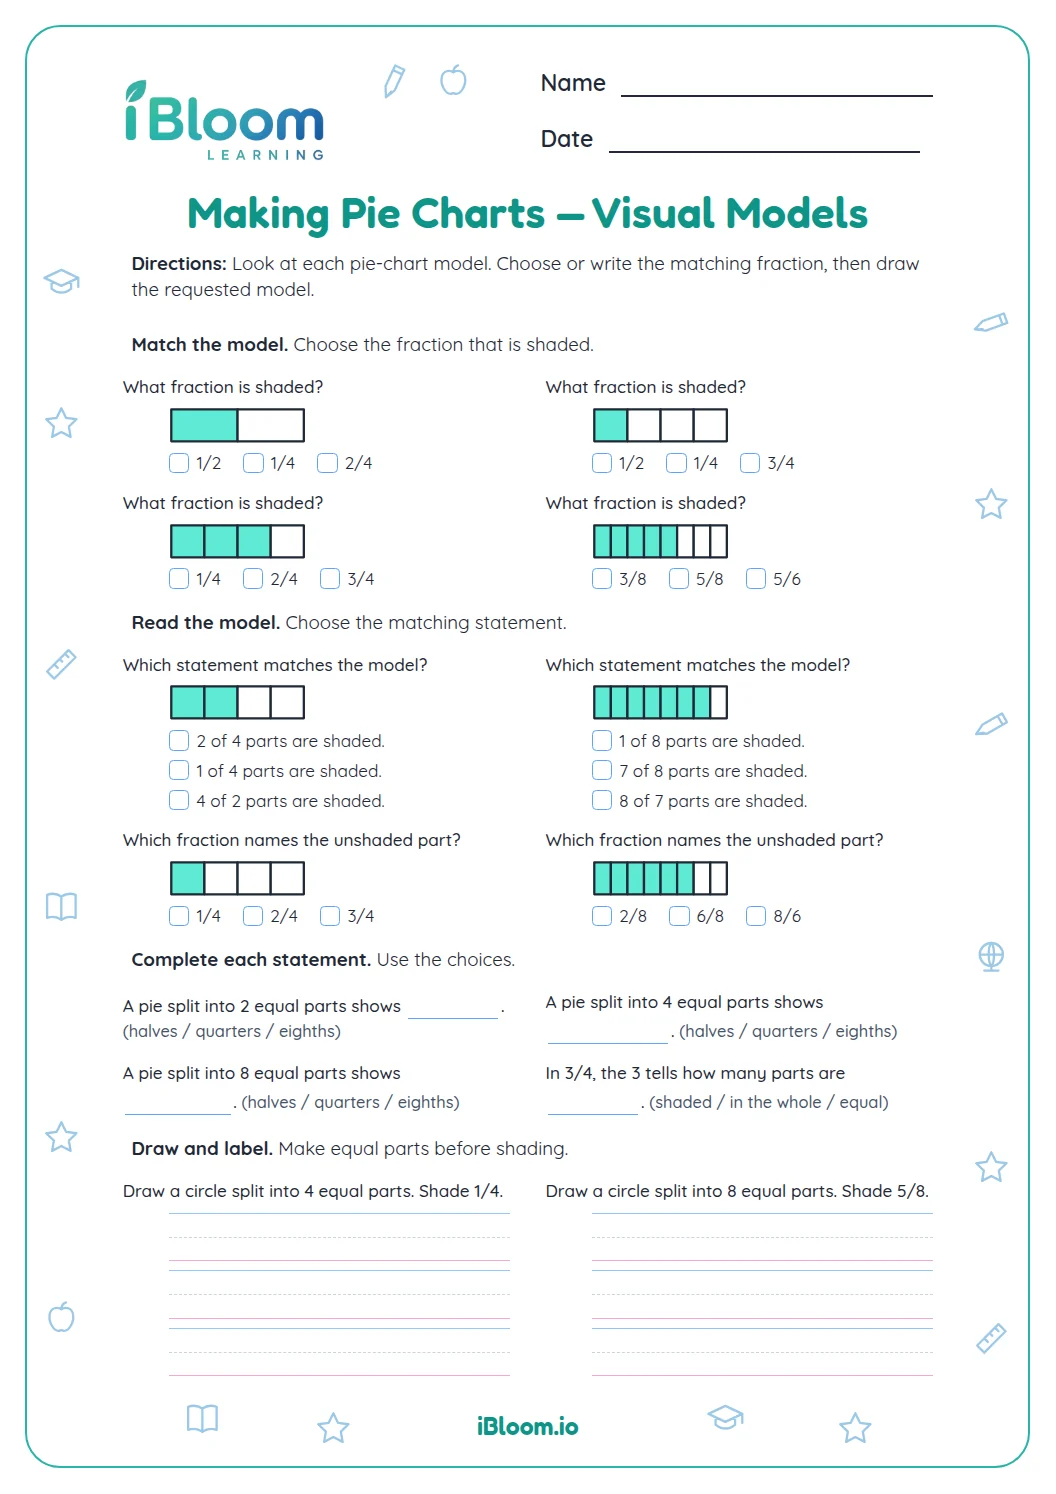
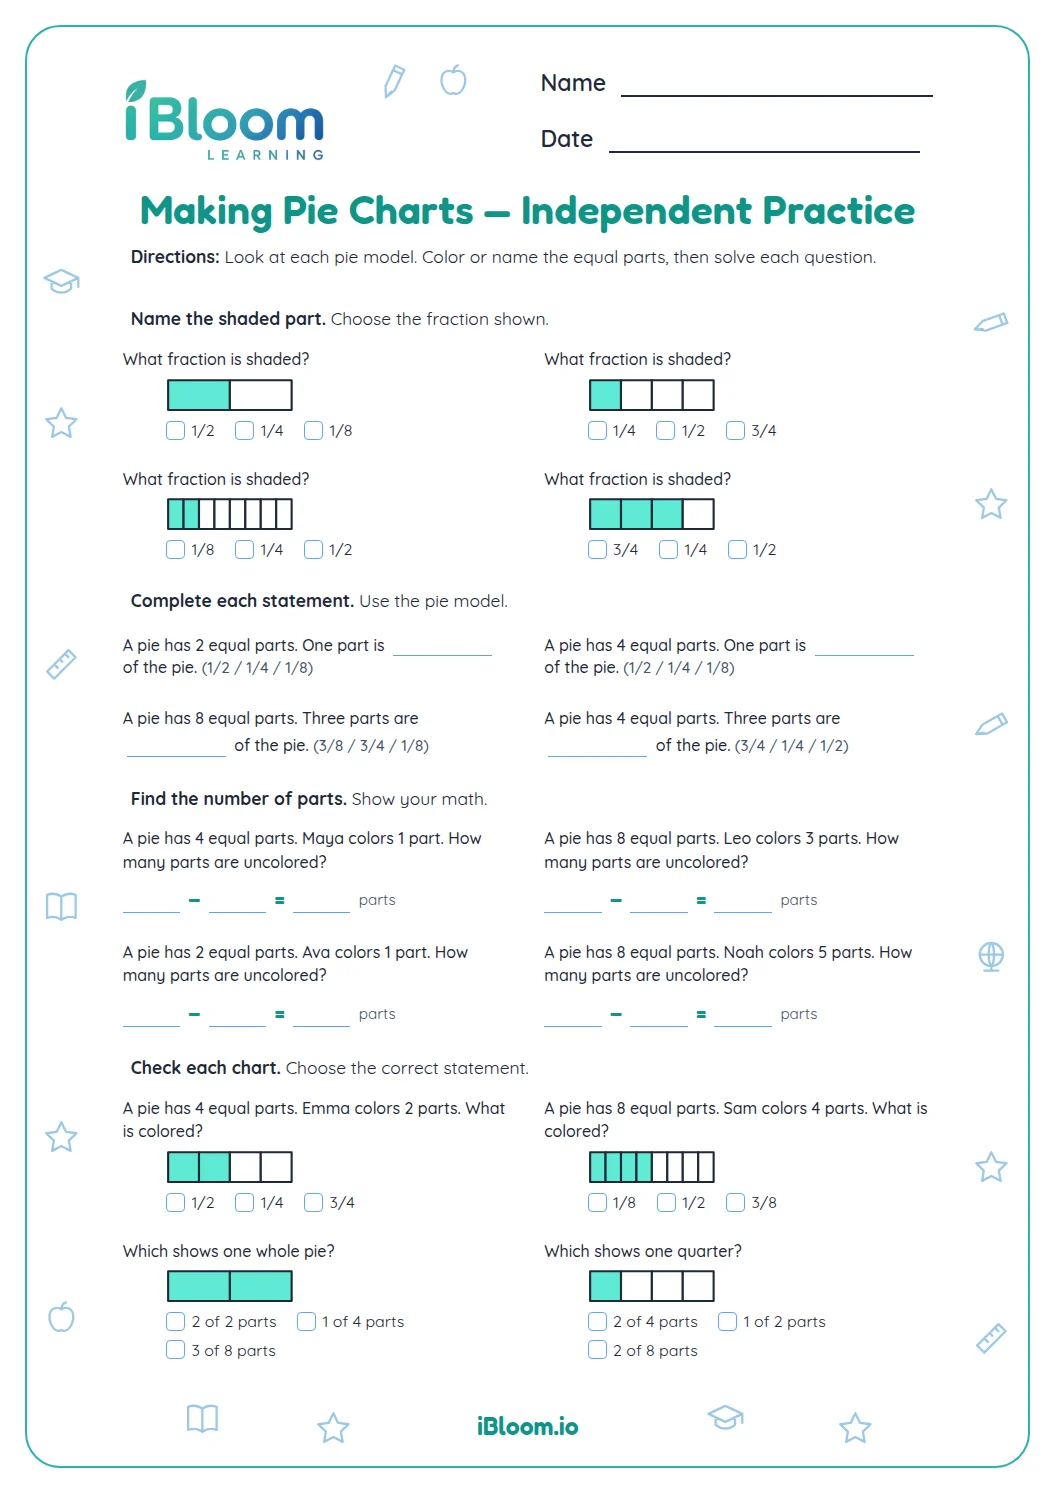
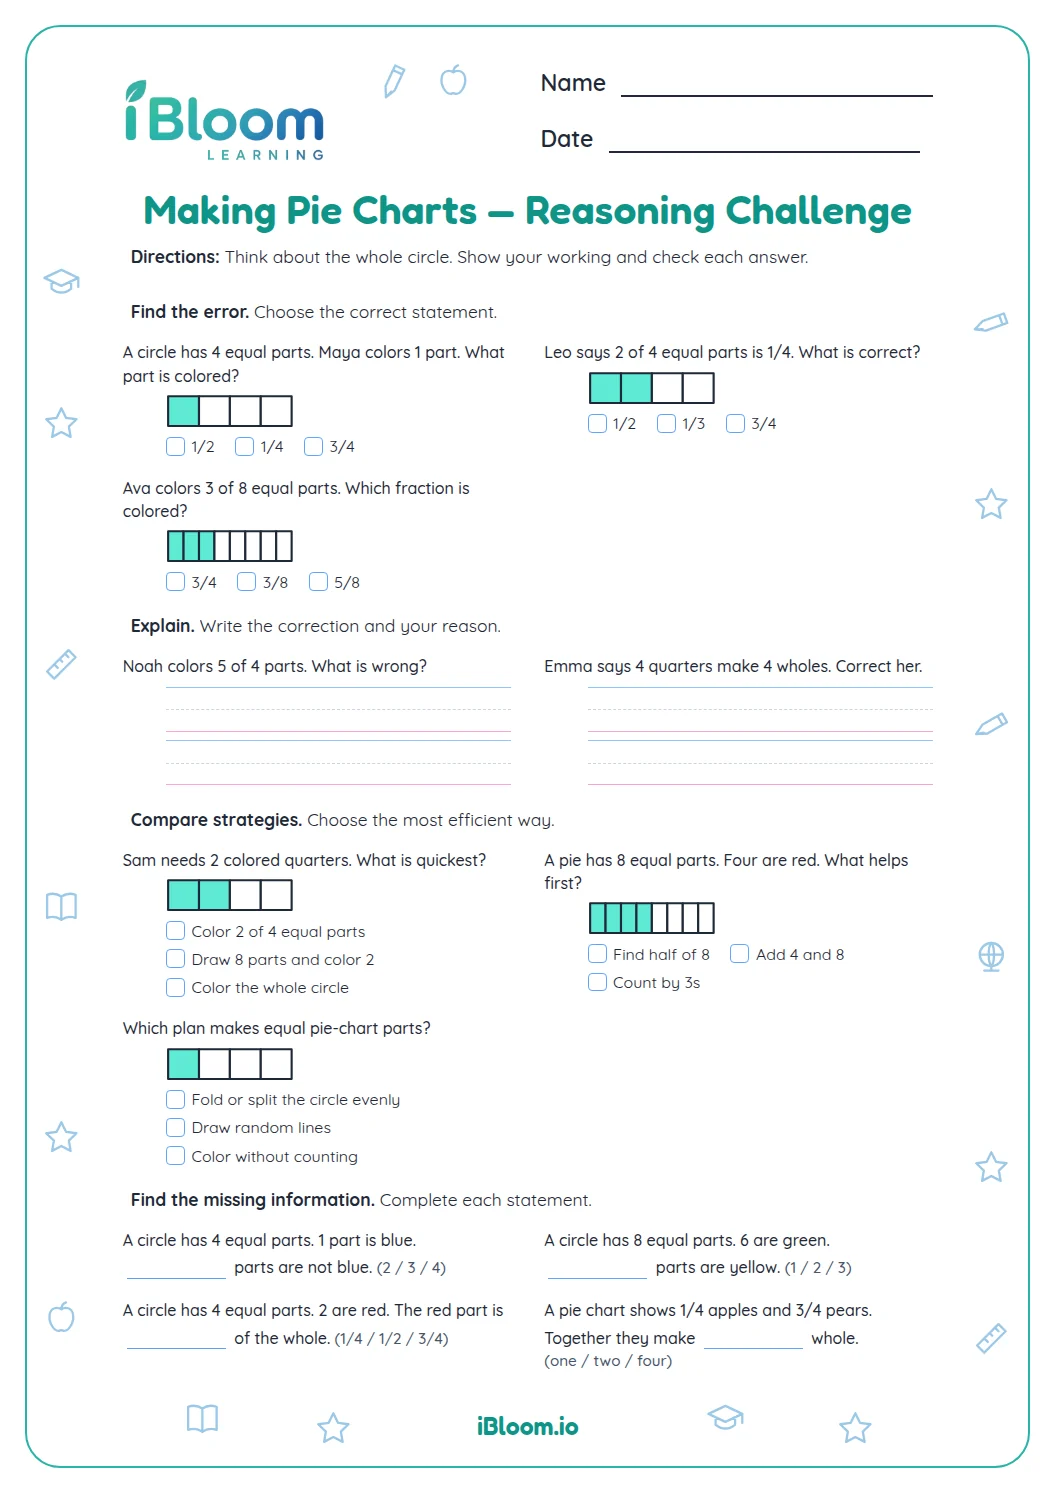
This free printable Grade 2 worksheet introduces pie-chart thinking through familiar class surveys. Each of the 16 short stories names the total responses and one selected group; a matching circle model shows equal parts of the whole with that group shaded. Students write the selected share as a fraction and check it with the separate answer key. The practice focuses on reading a part-to-whole display.
What does the whole circle represent?
The entire circle represents all responses in one survey. The equal slices divide that total into parts, and the shaded slices represent the selected group. In question 3, three of four responses are for comics, so the shaded share is 3/4.
- 1There are 4 equal parts in the circle.
- 2The selected category fills 3 parts.
- 3Write the shaded share as 3/4.
How do you write the selected share?
Count the shaded parts for the numerator and all equal parts for the denominator. Keep the denominator tied to the whole survey, even when fewer parts are shaded.
How do survey stories make the model meaningful?
The story names the question and category, such as a class poll about books, pets, or activities. The circle turns the selected response count into a visible part of all responses.
How to use this worksheet
- 1Read how many responses are in the survey.
- 2Find the selected category in the story.
- 3Count all equal slices in the circle for the denominator.
- 4Count shaded slices for the numerator.
- 5Check that the fraction describes the selected share of the whole.
Common mistakes and quick fixes
The mistake
Using the shaded count as the denominator.
The fix
Count every slice in the circle for the denominator.
The mistake
Writing the unshaded share instead of the selected group.
The fix
Match the shaded slices to the category named in the story.
The mistake
Forgetting that the whole circle represents all survey responses.
The fix
Read the total in the story before writing the fraction.
What to practice next
Make more practice
Questions parents and teachers ask
What does the circle represent in each problem?
The full circle represents all responses in the survey story. Equal slices divide the whole into parts, and shaded slices mark the category named in the question. Students write that category’s share as a fraction. Ask students to match the shaded slices to the category in the story before checking another response.
How many questions are included?
There are 16 short survey problems with matching shaded circle models. The contexts include pets, books, food, activities, colors, and weather. A separate answer key follows the worksheet pages. Ask students to match the shaded slices to the category in the story before checking another response.
How do students write the fraction?
Count the shaded parts for the numerator and all equal parts for the denominator. For example, if 3 of the 4 equal parts are shaded, write 3/4 for the selected share. Ask students to match the shaded slices to the category in the story before checking another response.
Why do some circles have two, four, or eight parts?
The models use different numbers of equal parts so students can read several simple survey shares. The denominator records how many equal slices make the whole, and the numerator counts the shaded slices. Ask students to match the shaded slices to the category in the story before checking another response.
Does the worksheet have an answer key?
Yes. The separate answer key lists the fraction shown in each model. After solving, students can check the total number of parts and shaded parts against the drawing and story. Ask students to match the shaded slices to the category in the story before checking another response.